Portfolio

Visualize anomalies to prevent downtime with Tableau integration

Softweb Solutions integrated Tableau with all the data sources of an oil and gas company to help them analyze their data to increase output, make fast and effective decisions, etc.

  • Live visual analytics for boundless data exploration
  • Connect to data on-premises or in the cloud
  • Secure, compliant, scalable and reliable data analytics
  • Boost output, lessen downtime and enhance customer service

Handling fleet management smartly to simplify reporting

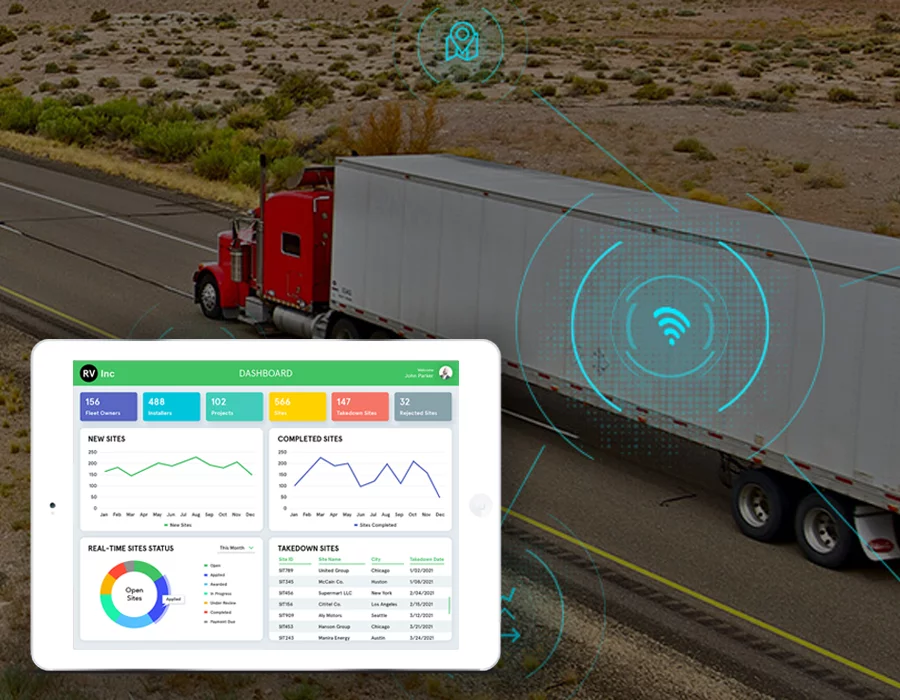
Softweb Solutions developed a lightweight fleet reporting web and mobile application using the Angular framework.

  • Track workflows of team members and respective clients
  • Features to manage the fleet from a remote location
  • A single portal to monitor fleet operations
  • Schedule analytics reports using Power BI

Enhancing operational efficiency with Power BI for an energy company

We developed a Power BI solution with dashboards that identifies energy consumption, usage patterns, trends and anomalies.

  • Analyze data efficiently
  • Track energy usage
  • Solve issues in real-time
  • Empower the workforce to perform analysis independently
  • Identify patterns, forecast risks and alleviate failures
  • Measure energy generation and outages

Creating insightful reports using real-time data with Power BI integration

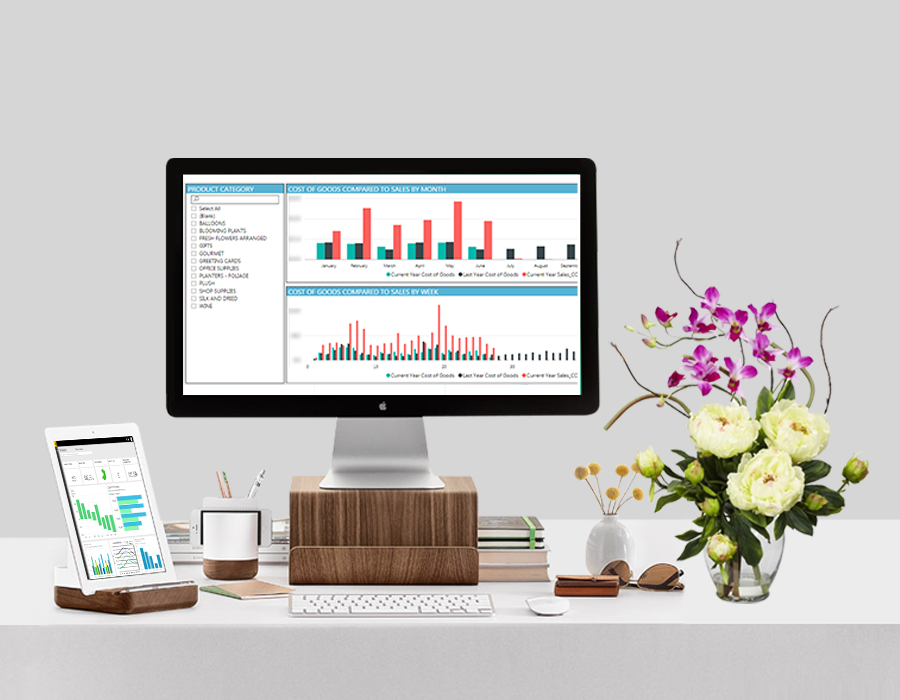
Our data visualization solution provides insights using MS Power BI interactive dashboard with existing real-time data stored in servers to make better decisions.

  • Generate insights for marketing campaigns
  • Track profit margin and sales
  • Generate analytical reports to understand customer behavior
  • Interactive dashboards to monitor the labor cost involved