Inventory
Get a centralized and visual representation of stock levels, product availability, order fulfillment status demand trends, etc.
From raw data to visual clarity, we create custom visual solutions that identify trends, guide actions, and boost performance
Talk to our expertsOur Clients
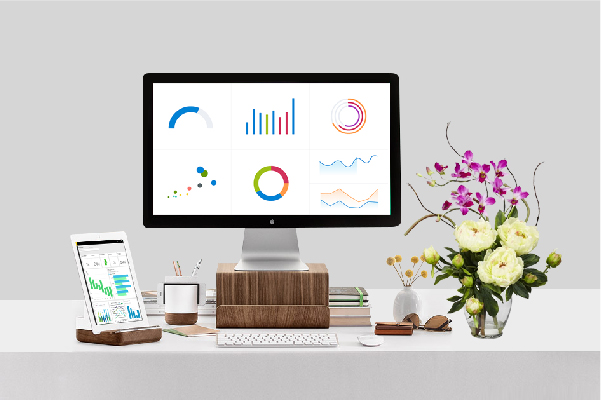
Data holds immense potential when understood visually. Our data visualization services decode intricate datasets, delivering crystal-clear insights that empower strategic decision-making and organizational transformation. With the right data visualization tools, our expert team translates complex information into intuitive, interactive dashboards and graphics. We leverage advanced platforms like Tableau, Power BI, and Logi Analytics to transform raw data into actionable, visually stunning representations. We translate data’s silent language into vivid visual narratives that can drive strategic breakthroughs for you.

Revolutionize your data landscape with custom dashboards engineered for precision and clarity. Experience a new level of insight as you transform raw data into strategic assets.

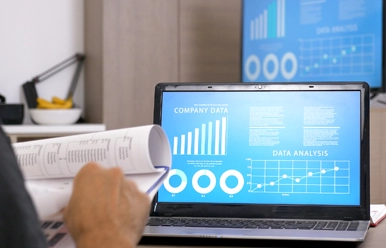
Leverage a cutting-edge BI platform that seamlessly integrates and elevates your data ecosystem. Our BI development solutions empower you with a unified view for strategic dominance and operational excellence.

Enhance your data’s impact with optimized visualizations that bring clarity to complex information. Our data visualization experts refine your visuals to ensure you uncover actionable insights efficiently.

Gain a competitive edge with real-time data monitoring that delivers instantaneous visibility and actionable intelligence. Stay agile and responsive to emerging trends with live data insights.

Navigate the data landscape with confidence through our expert strategy and consulting services. We provide tailored guidance to optimize your data strategy and achieve measurable business outcomes.
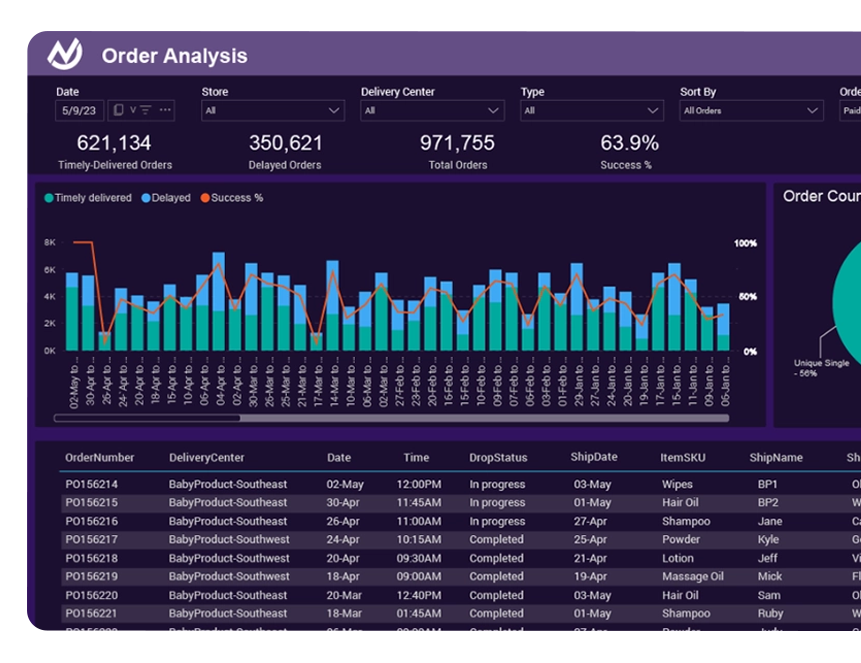
Get a centralized and visual representation of stock levels, product availability, order fulfillment status demand trends, etc.

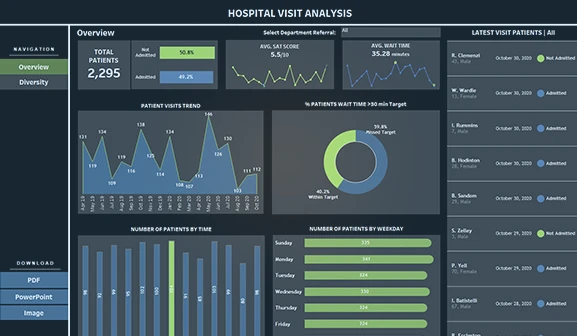
Get a holistic view of patient data, medical records, treatment outcomes and operational metrics.

Track financial health with centralized dashboard with financial performance, cash flow, budgetary analysis and key financial ratios.

Empower your organization with targeted HR dashboards for strategic workforce optimization and operational excellence.
Industry:
Manufacturing
Technologies
Power BI, Snowflake
Challenges
Business impact
Client
A leading baby products manufacturer
Industry
Renewable Energy
Technologies
Tableau, Salesforce, Oracle NetSuite
Challenges
Business impact

10+ years of experience in creating data visualization solutions across industries.
60+ experts in Tableau, Power BI, and Logi Analytics for data visualization and transformation.
350+ dashboards created using Power BI and Tableau for better insights.
Intuitive interfaces for non-technical users with Power BI and Tableau.
Adherence to governance and compliance for enterprise environments with Looker and Power BI.
Data visualization is the graphical representation of information and data using charts, graphs, and maps. It’s important because it simplifies complex data, making it easier to understand, interpret, and act upon, leading to faster and more informed decisions. To know more, write to us at info@softwebsolutions.com.
Big data visualization requires specialized tools and techniques, such as scalable cloud-based platforms and advanced analytics engines. We break down complex datasets into manageable visuals, use real-time processing, and apply interactive filters to ensure that even the largest datasets are intuitive and actionable.
The three major data visualization trends are:
The process starts with understanding your business objectives and data landscape. From there, we design wireframes, develop tailored visualizations, and integrate the solution into your existing systems. Our approach ensures the solution is not only visually appealing but also aligned with your strategic goals for actionable insights.
Yes, data visualization is in high demand across industries. As organizations generate more data, they require sophisticated tools to interpret and present insights visually. Companies that utilize data visualization effectively can enhance productivity by up to 30%, making it an essential asset for data-driven decision making.
Connect with one of the leading data visualization services companies
Discuss your requirements with our data visualization consultants
 100% Secure. Zero Spam.
By submitting this form you agree with the terms and privacy policy of Softweb Solutions Inc.