How Softweb Solutions unified data across EV charging stations to accelerate deployment and optimize performance
An EV charging network operator managed installation workflows and station performance data using separate spreadsheets. Softweb Solutions implemented a data engineering and analytics platform to centralize installation tracking and monitor performance. It also streamlined supplier inventory management across the network.
 Industry: Energy
  Business type: Enterprise
- Services: Data Engineering, Data Visualization, Analytics Implementation
- Technology: Tableau Prep, Tableau CRM, Salesforce, Einstein Analytics, Oracle
NetSuite
Client profile
Our client has 1,000 electric vehicle charging stations deployed across 35 states in the United States. They serve thousands of EV drivers who rely on their infrastructure for daily charging needs.
They operate at the intersection of sustainability and cutting-edge transportation technology. Their charge stations are compatible with all major auto manufacturers. With a mission centered on accelerating EV adoption, they support individual drivers and fleet operators.
Technical challenges
Rapid expansion of the EV charging network put pressure on the company’s operational and data infrastructure. Without a unified view, it was not easy for the operations team to monitor the progress of installation workflows, anticipate delays, or allocate resources effectively. Four specific challenges were:
No centralized data visibility
Installation data across stations was stored in Excel sheets, emails, and shared files. There was no unified view of where each project stood.
Complex multi-stage data management
Tracking and reconciling installation data across multiple stages was challenging without a centralized system.
Difficult data modeling in spreadsheets
Analyzing installation and supplier data in Excel was difficult. Version control issues and manual entry reduced the accuracy of insights.
Station-level performance insight
There was no reliable way to measure charging station efficiency. Detecting maintenance needs proactively was not possible.
Our solution
Solutions delivered through a unified data engineering platform
We designed and implemented an analytics platform that brought data engineering, governance, and interactive reporting into a single, scalable solution. Our engineers used Salesforce and Tableau to build the platform.
The platform replaced manual spreadsheet workflows with structured ETL pipelines, governed data models, and interactive dashboards. It gave every stakeholder, from project managers to operations leads, a real-time view of their respective data domains.

ETL pipeline and data standardization for multi-stage installation workflows
We implemented Tableau Prep as the ETL layer to extract, clean, and transform raw installation data from Excel-based sources. Our team built structured data flows to standardize inputs and ensure consistent, reliable data ingestion across installation stages, supplier records, and station metrics.

Scheduled data flows ensure that dashboards reflect the latest information. The ETL architecture reduced manual handling and removed version inconsistencies and data entry errors.
Data governance and modeling for scalable, unified reporting across the
network
We leveraged Salesforce’s native integration capabilities and implemented Tableau CRM as the primary governance and data modeling layer. We built structured data models to track installation progress across defined project stages.

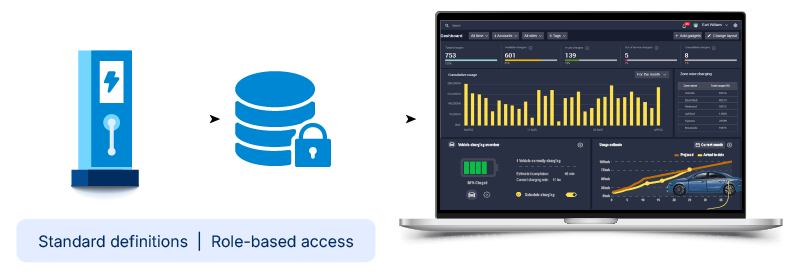
The governance model included controlled data access, which allowed teams to work from a single, authoritative data source. There was a standard definition for every data field and metric. Teams do not create their versions of calculations or interpretations. Every dashboard and report shows consistent numbers.
Interactive dashboard development for real-time operational and inventory visibility
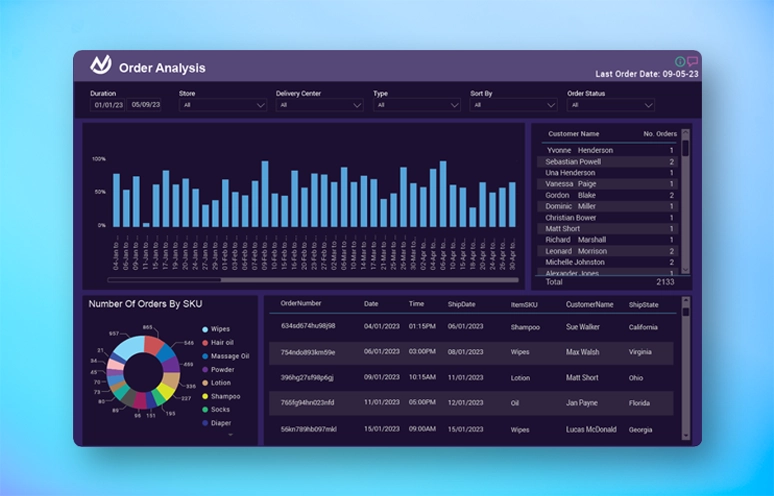
We used Einstein Analytics to design and deploy a suite of interactive dashboards tailored to the client’s operational priorities. Each dashboard served a specific function within the company’s workflow and delivered ease of use and analytical depth.
Dashboards provide monthly installation reports, project completion forecasts, and slot data at both state and project levels. Inventory modules helped procurement teams track supplier stock and spot shortages before they delayed installations.
Station performance and power consumption analytics for proactive network monitoring
We built an analytics module to track power consumption and performance at station level. This gave the operations team clear visibility into how individual stations performed against expected benchmarks. It supported data-driven decisions on maintenance scheduling and infrastructure optimization.

Performance data was visualized at the station, region, and network level, supporting both operational monitoring and strategic planning. The module was integrated with the broader analytics platform to provide a view of network health.
Vehicle make analysis and manufacturer intelligence for targeted network investment decisions
Our engineers implemented a data visualization layer that aggregated vehicle visit data to identify the top manufacturers at each station. Such insight gave the client visibility into which vehicle types used the charging network most frequently. It supported decisions on charging standards, equipment selection, and targeted network investments.

The manufacturer analysis was delivered through filterable dashboards. Business and strategy teams could explore data by station, region, or time without technical support.
Business goals and measurable outcomes
| Business objective | Business benefit delivered |
|---|---|
| Accelerate EV station deployment. | Installation managers gained a consolidated, real-time view of project stages across all active deployments. Delays became visible earlier, enabling early intervention and reducing average time-to-completion. |
| Improve supplier management and inventory control | Inventory visibility dashboards gave procurement teams live insight into slot and component availability by state and project. Supply shortfalls were identified before they impacted installation timelines. |
| Enhance station performance monitoring | Power consumption and stall performance analytics gave the operations team station-level visibility for the first time. Underperforming assets were identified and addressed. |
| Enable data-driven network planning | Monthly installation reports, project completion forecasts, and vehicle make analysis provided structured intelligence to leadership. These insights helped prioritize network investments and plan future expansion. |
| Reduce risk across the project portfolio | State-level and project-level slot data, combined with installation progress tracking, provided early warning signals. Early insights enabled the team to mitigate risk across a large and complex project portfolio. |
Tech stack
- ETL and data pipeline
- Tableau Prep (extract, transform, load workflows)
- Data governance and modeling
- Tableau CRM (Salesforce-native data modeling and governance)
- Analytics and dashboards
- Einstein Analytics (interactive dashboards, forecasting, reporting)
- ERP and data source
- Oracle NetSuite (source system for installation and inventory data)
- CRM platform
- Salesforce (integration layer and data environment)
- Reporting modules
- Monthly installation reports,
- project completion forecasts,
- state/project-wise slot data
- Performance analytics
- Station-level power consumption monitoring,
- charging stall performance tracking
- Inventory visibility
- Supplier stock tracking,
- slot availability by state and project
- Vehicle intelligence
- Vehicle make and manufacturer visit analytics by station and region
Similar case studies
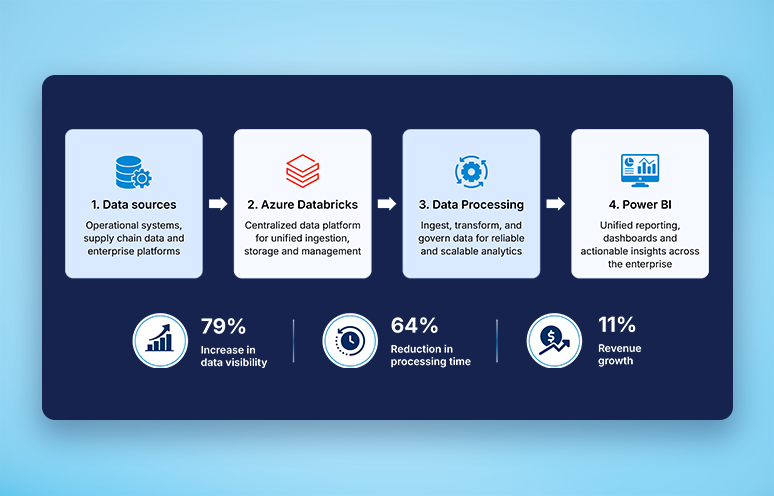
Streamlined data integration with Databricks
How Softweb maximized manufacturing efficiency or a leading baby products manufacturer

Improving freight management with large language models
Connect Now
Our experts would be eager to hear you.
