Data for any organization is crucial. Management of data across the organization becomes difficult and tedious. Also, deriving actionable insights from gathered data using traditional methods can be time-consuming. However, with a powerful tool developed by Microsoft, Power BI Desktop, you are provided with self-service business intelligence capabilities. With Power BI Desktop analysis services users get real-time insights using highly interactive visualizations. This enables them to get valuable insights of their business with efficient decision-making capabilities.
Power BI integration services and predictive model
Visually analyzed data can give users the ability to monitor KPIs in real time. Power BI integration enables businesses with excellent data visualization that can help them gather reports using intuitive and sharable dashboards.
Integrating Azure ML Studio and R script visual (Rviz) with Power BI enables users with what-if analysis. This helps businesses to get predictive models which enable them to predict revenue, marketing information, future prices and much more. Organizations can analyze historical data and predict outcomes based on the analysis report.
Now, let’s see what is new with reporting in Power BI Desktop.
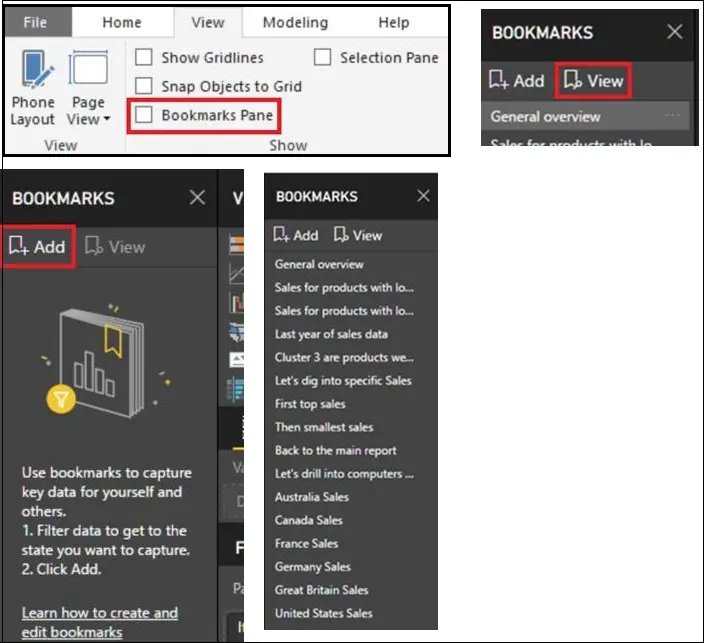
Bookmarking
Once you are ready with reports, you can bookmark and save interesting statistics as part of your report. Once you have a list of bookmarks, you can use those for organizing presentations of your report, creating report navigation, and more.
The following parameters are included in a bookmark:
- Current page
- Filters
- Slicers
- Sort order
- Drill location
- Visibility
- Any of the “focus” modes
You can add multiple bookmarks, rename them, view and use them as many times as you require. If you want to use your bookmarks as a story or in a presentation, you can use the ‘View’ option to enter into the view mode for bookmarks. You will be in the view mode where you can preview all your bookmarks in the Power BI Desktop. It’s a great way to navigate bookmarks in the Power BI tool.
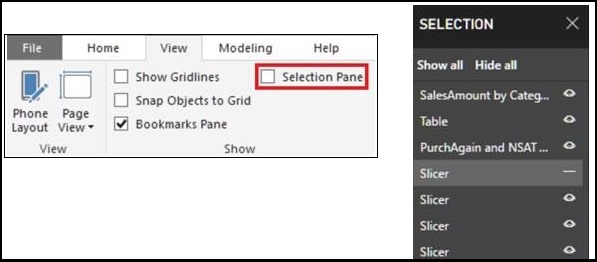
Selection pane and visual display controls
A selection pane lists out all objects on the report page that you are currently viewing and allows you to select visual(s) from the report. This is very useful when you are dealing with complex reports with many overlapping charts as it helps to simplify them.
It also enables users to hide visuals on the report. By combining this feature with bookmarking, users can create very interesting reports that can be further utilized for storytelling and presentations.
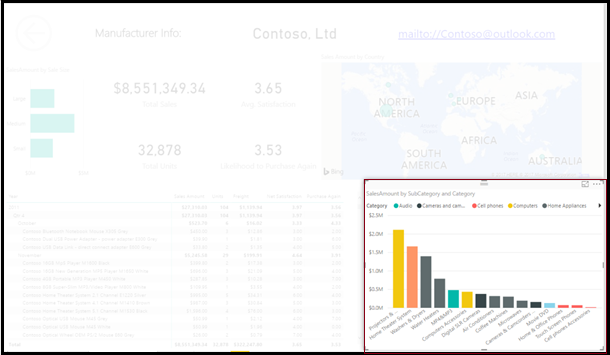
Spotlight
This sounds a little fancy now. Spotlight is a way to call attention to a specific chart during presentations. It enables users to easily call attention to a chart without losing the context of the report. It eliminates the need of the BI professionals to go back and forth when presenting their case. Users can spotlight a visual or a particular chart to fade out all the other charts on the page. You can easily remove the spotlight and get back to the original report. The spotlight feature can also be included as a part of bookmark.
Softweb Solutions provides data visualization and analytics services. With connected data sources powered by Microsoft’s Power BI, all you need to do is ask the questions that you want answered. Our Power BI services enable clients with adept and easy decision-making process.
To know more about the solution, talk to our experts.