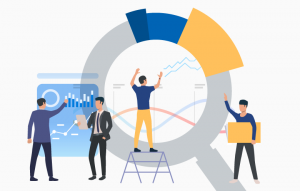
The rising needs of Big Data Analytics
As the volume, velocity and variety of data continue to reach unprecedented levels, big data is now a reality. The increasing volume and different formats of data (both structured and unstructured data) make it more difficult for enterprises to decipher the information that truly counts. In order to turn big data into actionable insights, companies must understand the possibilities of big data analytics. Companies that effectively create and implement big data analytics strategies stand to discover unknown correlations, hidden patterns and other useful information that can be used to make better decisions.
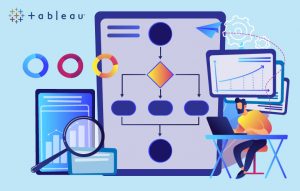
Identify actionable insights with Tableau
Tableau is an advanced business intelligence tool that creates interactive data visualization dashboards and generates insightful reports within a user-friendly environment. It supports desktop and browser based interfaces, and makes spreadsheets and databases understandable to people who need actionable insights. This data visualization tool allows enterprises to easily connect to data, allowing them to have the edge over conventional analytical methods and present the data in a much better and insightful manner. In fact, beginners can easily implement Tableau in their workplace and create real-time dashboards.
Tableau highlights
Business intelligence has long depended on some kind of data visualization, but the game has changed now. Any data source can be virtually connected with Tableau to gain immediate insights by transforming the company’s data into interactive, appealing visualizations. It enables enterprises to go beyond dashboard widgets and canned reports and empowers users to quickly create highly insightful visualizations.
[Tweet “#Tableau – A #BusinessIntelligence tool to visualize data for better insights”]
Data exploration
Tableau enables users to instantly find trends, nuances, and outliers without requiring them to deal with complex spreadsheets or a report with limited information. Users can visualize and interact with data by asking questions using natural language.
Let your data tell your business story with Tableau
Webinar agenda
- Overview of Tableau and integrations
- Various data visualization trends
- Must have data analytics trends in 2021
- Use cases and live demo
- Present day examples/ case scenarios
- Q & A
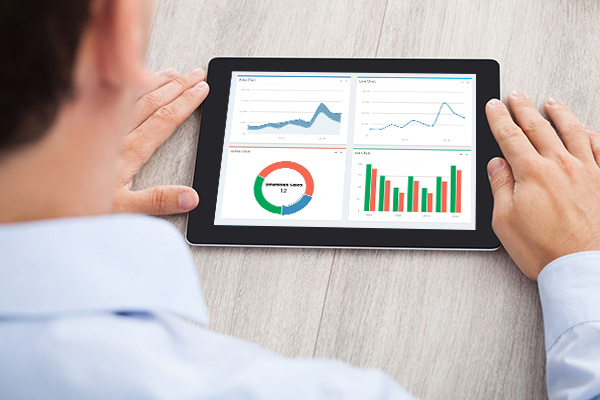
Business Dashboard
With Tableau, users can easily create interactive, real-time dashboards to turn data into actionable insights, with no technical know-how and with a minimum of fuss whatsoever. Users can easily combine multiple data sources, and add filters and drill down with just a few clicks. Tableau dashboards can be shared on Tableau Server or Tableau Online, and embed them into corporate portals or wikis with very simple steps.
Connect with any data source
It doesn’t matter where the company’s data resides. Tableau enables a company to access multiple data sources and analyze data in one place. Its native connectors, such as Oracle, Teradata, MySQL, Microsoft SQL Server, HP Vertica, and EMC Greenplum are optimized to increase performance and enforce security protocol. A company can also use the ODBC (Open Database Connectivity) protocol to access its data, in case a native connector is not available.
Getting started with Tableau
A well-thought-out and executed big data and analytics strategy will eventually make businesses smarter and more efficient. We have a team of data experts who can consult you to create and implement a sensible data analytics strategy to get the right information that matters most to your business.