
A massive volume of data is gathered by healthcare organizations and deposited in different storehouses throughout the whole organization. It is challenging to identify cost-saving opportunities in countless supply chains due to these silos. Connecting these information islands is essential for understanding the big picture and making wise business decisions. Therefore, healthcare providers must increase their capacity to combine and merge data in a centralized location for analysis. Predictive models are integral to advancing healthcare analytics, and Tableau serves as a powerful ally in optimizing its effectiveness.
Healthcare and life sciences firms can enhance the health of patients with the help of data-driven insights. This is where a data visualization tool like Tableau comes to the rescue. In addition to its core competencies in data visualization, Tableau adds predictive analytics and machine learning (ML) capabilities to health systems.
The use of Tableau for predictive analytics helps healthcare in the following ways:
- Disease detection
- Personalized care delivery
- Smart electronic health records
- Informing healthcare policy and practice
Let’s begin with what data visualization means for healthcare
Data visualization is the process of analyzing vast amounts of data and disseminating the results in a visual context. It is a widely used approach in the era of big data.
Large corporations like Amazon and Apple rely on data sources and their visualization. It helps them maximize operational efficiency while streamlining and supporting their business decisions. Hospitals are currently experimenting with data visualization to boost productivity and highlight medical advancements.
A hospital can employ data visualization to track patients’ development and overall health while analyzing costs, efficiency and patient satisfaction. However, due to the rising volume of data, it has become imperative to involve business analysts in the process of managing healthcare data efficiently.
Data analysts must be proficient communicators, thorough researchers, and highly motivated by data to identify and report on key performance indicators (KPIs). Many hospitals are beginning to use enormous volumes of crucial data now. Therefore, the adoption of data visualization in healthcare needs to be accelerated.
Preventive and predictive medical visualization
Even though the future is unpredictable, data analytics has many divisions in medical technology that can provide different analyses to help professionals work with both past and future diagnoses.
For instance, descriptive analytics examines historical data’s past performance, behavior, and relevance to a topic in the past. Where predictive analysis strives to forecast and foresee future diagnoses and diseases for prevention, the diagnostic analysis aims to comprehend why specific diseases occur and explain their principal causes.
The goal of prescriptive analysis is to examine many scenarios and forecast outcomes before a healthcare professional makes the final decision.
In addition to monitoring health, data visualization can also help medical personnel predict future illnesses and identify the causes of dangerous conditions and previous illnesses.
How to use Tableau for healthcare
Admins can create user-friendly visualizations that can be easily understood by doctors, patients and government officials using Tableau. The main categories of graphics used in the medical sector nowadays are defined below:
1. Interactive dashboards
Healthcare organizations often use dashboards, which combine many interactive reports, as their primary visualization tool. They might be a part of reporting software designed to meet the specific needs of a company or integrated with data analysis functionality into existing software.
Dashboards are classified into three categories, primarily:
- Strategic for observing patterns and trends over time
- Operational for showing data in real-time
- Analytical for more sophisticated analysis
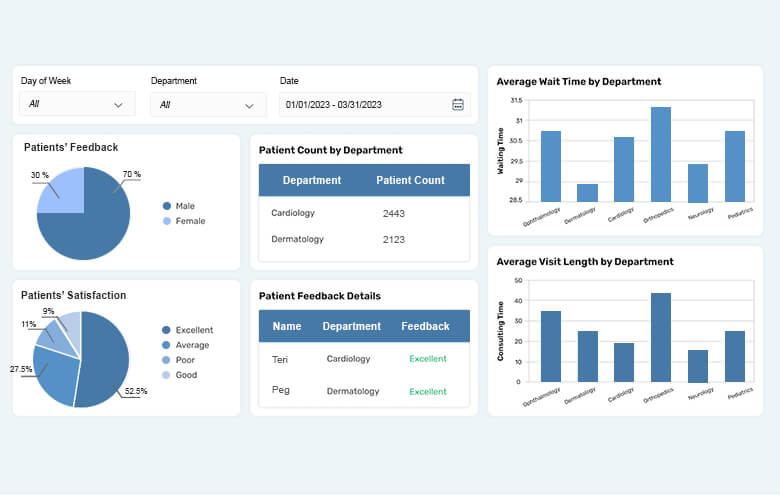
Patient experience analysis dashboard
2. Interactive apps, sites and widgets
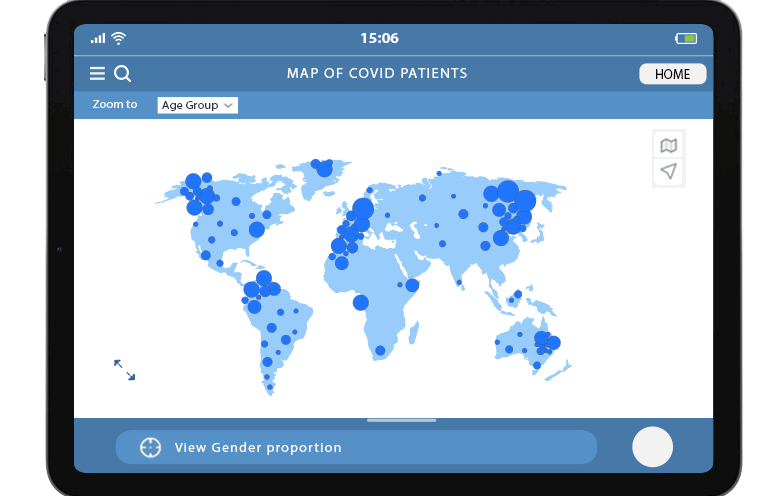
Users can pick how they interact with data and concentrate on what is important by using interactive maps, websites, or widgets. For instance, healthcare organizations can provide an interactive website to examine different illnesses and their causes. It is possible for users to select a nation, age, or gender category, or to flip between maps and charts so that they can understand and analyze them.
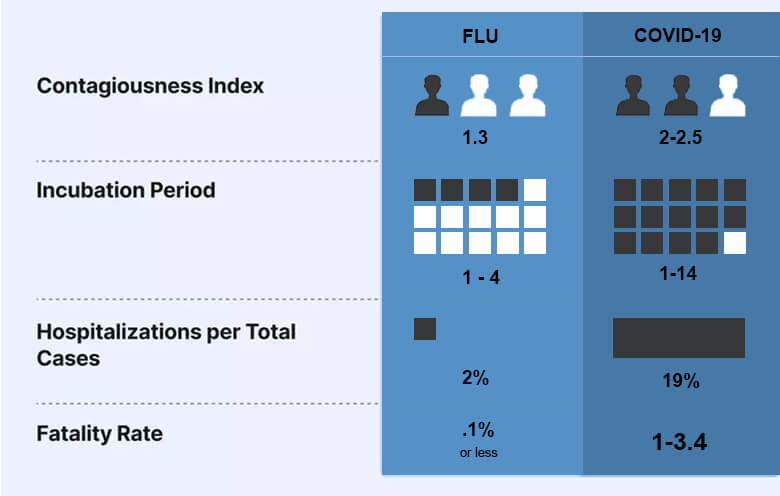
3. Infographics and motion graphics
Infographics are powerful visual representations for illustrating complex data in an easily understandable manner for the public. Animated infographics, such as motion graphics, can be found in educational videos, promotional materials, or tutorials.
How machine learning helps improve healthcare
The time to shift to electronic medical records is approaching very fast. Medical practitioners can gain actionable insights, enhance patient care, make more accurate diagnoses, and reduce the cost of healthcare by combining analytics with machine learning. Healthcare companies like Pfizer and Providence have already started to reap the rewards of analytics augmented by natural and artificial intelligence.
Some procedures are best suited to machine learning. For instance, the integration of ML with radiology, cardiology and pathology is resulting in the early detection of anomalies or heightened emphasis on worrisome areas. Long-term data patterns can help doctors treat patients at the bedside since they will be able to predict high health risks like heart disease.
For example, wearables produce enormous quantities of data about the wearer’s health. Many of them utilize AI and ML to notify the wearer or their doctor about problems as well. This supports preventative actions and responses to crises.
How data visualization improves healthcare – Data preparation, data modeling and data visualization are closely associated with data analysis. Analytics in healthcare is becoming more sophisticated with the application of artificial intelligence and machine learning. The deployment of visualization technologies is a necessity for enterprises to fully profit from data analysis.
Let’s see the advantages of data visualization in healthcare
Improved patient care
Visualization helps medical professionals spot hazards more quickly and respond to them by focusing on what is important. Doctors can analyze real-time data on patient health status to categorize and organize them based on the care and attention they require. A dashboard that contains all patient records prevents medical practitioners from overlooking crucial data. This would lower the instances of drug intolerance and enhance the effectiveness of treatment.
Trends and pattern recognition
By utilizing data visualization software that has built-in predictive analytical capabilities like Tableau, physicians can estimate changes in a patient’s health condition and provide more accurate diagnosis. For instance, gathering heart rate information from wearables and fitness apps can flag potential problems before they materialize.
The government can make strategic decisions about public health by identifying trends in statistical and research reports and recognizing patterns in patient care by visualizing healthcare data. For instance, when the death rate per million people reached eight, 90% of places in the US had enacted regulations requiring the wearing of masks and social seclusion.
Data presentations for different audiences
Visuals can be quite helpful when you need to convey data to business owners and other stakeholders or utilize it in healthcare marketing strategies. Visual stuff is easier for our brains to comprehend than long passages of text. Regardless of data literacy or business analytics expertise, anyone can produce an insightful understanding and make data-driven decisions with healthcare data visualization technologies.
Additionally, using infographics and charts that are clear and simple to read, will assist patients to become more engaged and conscious of their condition. This would result in better lifestyle decisions and encourage attention to areas that require development, such as physical activity, body weight, or eating patterns.
Accelerated performance
Real-time data visualization, compared to time-consuming manual reporting, vastly speeds up the interpretation of data. This helps healthcare organizations reduce process inefficiencies, speed up decision-making and minimize expenses.
Medicare, for instance, awards or penalizes hospitals financially based on patient satisfaction ratings. By tracking and visualizing patient feedback about communication with medical staff and wait times, hospitals can identify areas that need improvement.
Errors and fraud detection
Medicare fraud and abuse cost insurance companies and the government a very heavy amount annually. This results when people engage in fraud schemes like forging prescriptions, submitting several bills for the same service, duplicate billing, phantom billing, insurance fraud, etc.
Healthcare facilities can improve the transparency of the links between patients, practitioners, providers, payers and claims through data visualization. Users can avoid mistakes by using a data visualization tool like Tableau which combines ML and AI technologies. This helps them see anomalies and probable fraud events connected to medical bills or prescriptions immediately.
Implement Tableau to visualize your healthcare data and draw useful insights!
Data analysis is one of the critical phases of data visualization for the healthcare industry. It promotes quicker information interpretation and deeper understanding. This leads to better decisions and prompt actions when they are required. Healthcare organizations can enhance performance, coordination and treatment as well as educate patients with data visualization.
Working with an experienced tech service provider like us will help you get started and take advantage of feature-rich visualization software personalized to cater to your business requirements. To know more about how Tableau healthcare visualization can help in improving patient outcomes and at the same time, boost your business, please get in touch with our experts!