To remain profitable in any business for the long term, constant steps must be taken to keep up with the competition. Especially in the retail industry, where companies deal directly with end consumers to meet their ever-changing needs and expectations.
Microsoft Power BI platform for retail companies is an option that large and medium-sized retailers can adopt. This will enable them to analyze the data and extract actionable insights. This lets companies monitor factors that impact their business in real-time, such as:
- Gross sales
- Profit
- Countries served
- The most in-demand products
- Best month for highest orders received
- The products most-sold in a particular year and more
These insights obtained from Power BI can be used in a variety of ways to generate higher ROI for your business.
Popular brands like Starbucks, a global coffee retailer, uses Power BI to analyze data from their loyalty program, mobile app, and point-of-sale systems to gain insights into customer preferences, product performance, and store operations. They use Power BI to identify trends, optimize store layouts, and personalize promotions to enhance customer experience and increase sales.
Let’s take a closer look at popular 2023 Power BI trends for retail industry:
1. Switch to smart product marketing
Marketing serves as an effective medium of communication in the retail industry. If you have the right data at the right time, you can optimize your campaigns to get better results. Get precise answers in numbers to questions like:
- Which of our campaigns are the most popular and what is their profitability?
- How many leads from a marketing campaign are converted into real business?
- What is the average cost of a lead?
- What is the effectiveness of a marketing campaign?
You can view answers to all such questions on a single dashboard. Just decide the KPIs important for your business and create a customized dashboard to take data-driven decisions. There are multiple marketing sources from which data can be collected and processed to derive meaningful insights, such as:
Insights from web page analytics
Among the myriad benefits of Power BI in retail industry, it primarily empowers marketers with intelligent analysis of data collected from websites and other sources to:
- Analyze user behavior on your website over time.
- Present a clear view of visitors’ demographics to obtain information about their age, gender, spending etc.
- Create a customer analysis dashboard that discusses product sales and profits for region-wise customers data. The dashboard may contain region-wise monthly/yearly sales analysis, customer specific growth and profit, grouped products profits, channel specific sales and profit, and more.
- Learn about the sessions on your website, the devices people use and where your visitors come from.
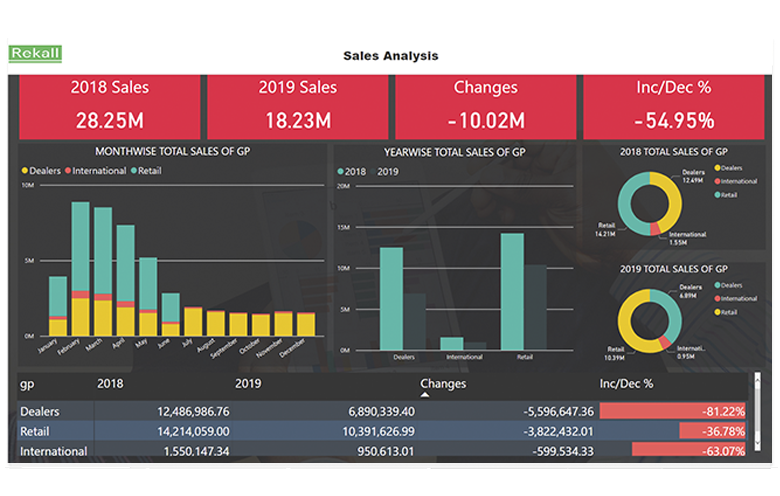
For example, an appeal retailer’s website analytics may display cumulative and region-wise total sales, gross margin, number of transactions, total revenue, number of visitors, conversion percentage along with top or bottom ranking products in sales.
The information may look like this when presented together in one in Power BI retail dashboard:
Social media platforms
Social media is one of the most popular platforms to market your products online as it helps brands to interact with consumers in real-time. Features of Power BI can be leveraged to:
- Determine the effectiveness of a social media campaign.
- Tailor social media campaigns by identifying patterns and trends in user behavior and interactions.
- Combine structured and unstructured data from social media to form a complete picture of the outcome.
- Understand the demographics of your followers on social media and design your posts accordingly for maximum engagement.
Predictive analytics
- Power BI’s AI capabilities help retailers visualize the future by finding patterns among huge amounts of data. Retailers can leverage AI insights to offer customization.
- Competitor analysis for market dominance and assistance with product pricing.
- Predict sales and inventory for improved optimization and a better understanding of profits and spends.
2. Make inventory management simpler
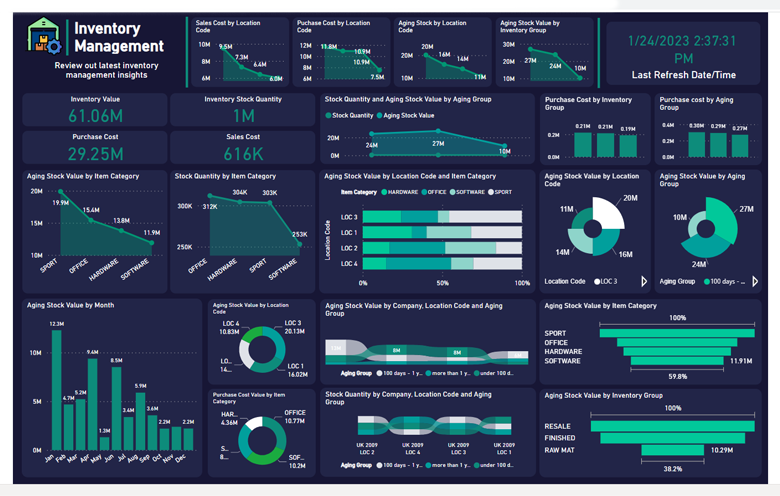
Power BI for retail allows you to manage inventory and find insights in real-time. Inventory management dashboard displays inventory value by item name, vendor name, last order date and expected cost of re-stocking, as shown below.
- Get proactive alerts for potential out-of-stock products with customized Power BI retail dashboard.
- Allows you to manage inventory for a variety of products across multiple warehouses.
- Provides every vendor or supplier with the inventory status of each warehouse and the value generated by each of them. Offers detailed business data analysis to identify sale patterns based on demographics for the best assortments.
- Increase profits by expanding or narrowing assortments by making informed decisions based on cost analysis and sales figures to
3. Global superstore analysis
The global superstore can leverage a custom Power BI retail dashboard to avail itself of a comprehensive view of overall store sales performance. Power BI’s key features include interactive dashboard, highly effective visualization, application of best practices in data visualization and highlighting critical information to allow users to make quick decisions.
- Provide high-level detailed analysis of global store KPIs information on a single screen display.
- Analyze global store data regarding quantity, sales and profit with just one glance and make business-oriented decisions.
- Assists you in maintaining the brand reputation by ensuring that all clients receive unified user experience.
The dashboard includes various global store information as shown below:
4. Keep up with changing consumer trends
Analyzing consumer behavior can help businesses plan and meet their sales goals faster. Power BI is a self-service visual data analysis tool that allows its users to make smart decisions by providing businesses with deeper insights into their customers. It enables data processing through drag-and-drop gestures with very little manual work.
- Study customer behavior on your website to understand the shift in consumers’ preferences over time.
- Get the flexibility to sub-group your customers based on their region, high or low margin clients, etc.
- Obtain average transaction value or average sales value per customer. This data can be used to send special coupons to long-term customers to keep them loyal to the brand.
5. Offer an omnichannel experience
Power BI’s supervisor dashboard provides omnichannel insights and sentiment analysis. With rapidly growing technology, retailers are using technologies like data visualization to enhance the online and offline shopping experience.
- Feature-rich data visualization and analytical capabilities of Power BI aggregate data from all sources to help retailers predict user behavior.
- Get a unified picture from multiple data sources such as customer surveys, loyalty programs, campaigns, CRM and sales.
- Gain information about customers’ visits and returns to various touchpoints throughout the customer journey.
- Studies the buyer’s journey and consumer habits by tracking the cross-channel conversion rate.
- Replace low-yield activities with promotional offers to yield higher returns.
Meet tomorrow’s customer demands today!
The real power of the retail industry lies in its data. Data can be automatically processed and converted into readily consumable insights leading to streamlined operations. Power BI is a powerful application of business intelligence in the retail industry, providing retailers with data-driven insights and analysis to better understand their customers and optimize their business operations.
Our data experts can help you transform your business data by integrating Power BI services with systems and creating a customized dashboard to extract valuable insights. Power BI’s data processing capabilities enable you to gain insights that would not be possible otherwise. Stay ahead of the curve by scheduling a free consultation today!