Overall Equipment Effectiveness (OEE) is a comprehensive metric that evaluates the efficiency of production equipment by factoring in availability, performance, and quality. It provides a unified view of how effectively your assets are operating and pinpoints areas where productivity can be improved.
As manufacturing grows more complex and competitive, manufacturers need precise, real-time visibility into how every asset performs, where losses occur, and how operations can be continuously improved.
An OEE system monitors, analyzes, and reports critical information to assist manufacturers in making more intelligent operational choices. It integrates machine availability, performance, and quality into one metric that allows you to observe losses, reduce waste, and foster continuous improvement.
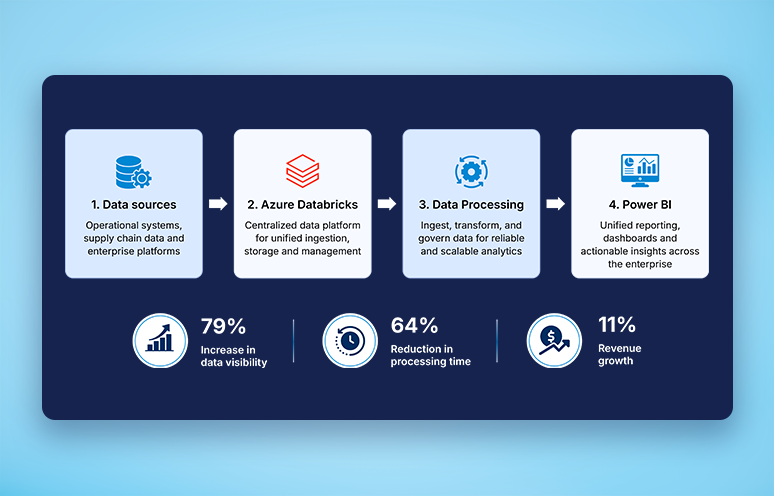
However, having data is only the beginning; how that data is visualized and understood makes all the difference. This is where Power BI plays an important role. It acts as a bridge between raw OEE data and actionable insights and turns production metrics into interactive visualizations and dynamic dashboards. This would enable manufacturers to explore OEE performance in real time, identify inefficiencies quickly, and respond with agility.
This blog discusses the powerful collaboration between OEE and Power BI, and how their Power BI integration can help manufacturing enterprises make smarter, faster, and better decisions.
Let’s start by understanding the concept of OEE.
What is overall equipment effectiveness?
Overall equipment effectiveness is the ratio of fully productive time to planned production time. OEE measures the percentage of manufacturing time that is actually productive and helps organizations in determining and removing inefficiencies within their operations.
OEE measurement provides information on how to systematically improve your manufacturing process because it can identify losses, measure progress, and optimize manufacturing equipment productivity (i.e., waste reduction).
A 100% OEE score means your machine makes only good parts, as fast as it can, with zero downtime. It’s the ideal scenario of perfect quality, speed, and continuous operation.
How to calculate OEE?
We calculate OEE by applying the following formula:
OEE = Availability x Performance x Quality
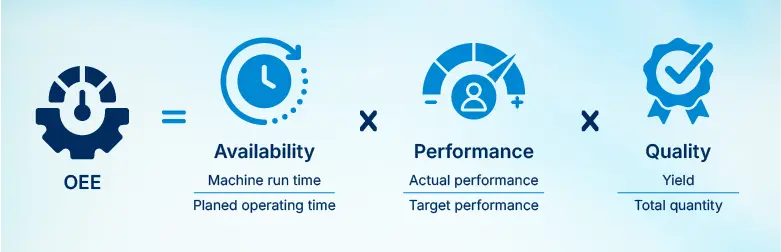
This calculation considers three important factors:
- Availability: This calculates the actual production time against planned production time. It takes into consideration factors like equipment breakdowns, changeovers and scheduled maintenance.
- Performance: This score evaluates the efficiency of the equipment in relation to its full potential. It takes into consideration factors like equipment speed, minor stops and idling time.
- Quality: This measures the production rate of “good count” products with no defects or rework. It considers issues such as scrap, reject, and rework.
The result indicates how efficient the equipment or process is. A rising percentage of OEE indicates better performance and efficiency, while a low percentage indicates room for improvement.
Why is Power BI the perfect fit for OEE analysis?
Power BI is ideal for OEE analysis as it brings clarity and depth to insights. Power BI stands out not just for its visual appeal, but for how it empowers teams to move from raw metrics to real-time, informed action.
1. Built for integration
Power BI connects to various data sources, including SCADA integration systems, ERP, MES, and other databases, to extract data that pertains to OEE. It supports data cleansing, transformation, and modeling to validate data accuracy and consistency.
2. Delivers clear and impactful visualizations
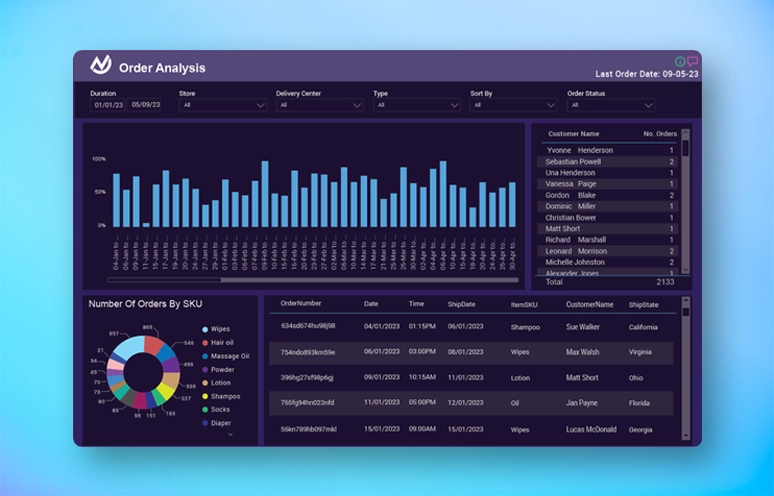
Power BI turns raw data into clear visuals like charts, graphs, and KPIs that highlight equipment performance. These visuals are interactive and allow users to drill down into specific metrics and explore trends over time. Building on this, custom reports help teams focus on key OEE dimensions and adapt insights into their operational goals.
3. Enables real-time monitoring and instant alerts
Power BI monitors OEE data in real-time, giving current insights into the performance of equipment. It enables the development of alerts that inform stakeholders of important changes or outliers in OEE measures.
4. Supports predictive maintenance with actionable insights
Power BI identifies trends from historical OEE data and predicts possible equipment failures, allowing for proactive maintenance. It analyzes the reason for downtime and highlights areas of improvement to avoid shutdowns.
5. Facilitates benchmarking and goal tracking
Power BI provides benchmarking against industry norms and establishes achievable OEE goals. This facilitates ongoing improvement initiatives and monitoring progress toward the desired OEE levels.
6. Drives cost reduction through data-led optimization
Power BI helps reduce costs and increase profitability by identifying inefficiencies and maximizing resource usage. It facilitates effective decision-making on equipment maintenance, hiring, and production scheduling.
7. Fosters cross-functional collaboration through shared data access
Power BI offers a centralized platform to share OEE insights across various departments, promoting collaboration and alignment towards shared goals. It allows cross-functional teams to monitor performance, detect bottlenecks, and collaborate to enhance OEE.
Benefits of using OEE system with Power BI
Integrating an OEE system with Power BI creates a smarter feedback loop for your manufacturing floor. This collaboration helps you discover patterns, refine processes, and stay ahead of operational issues before they escalate. It’s where operational visibility meets continuous improvement.
- Real-time visualization and analysis
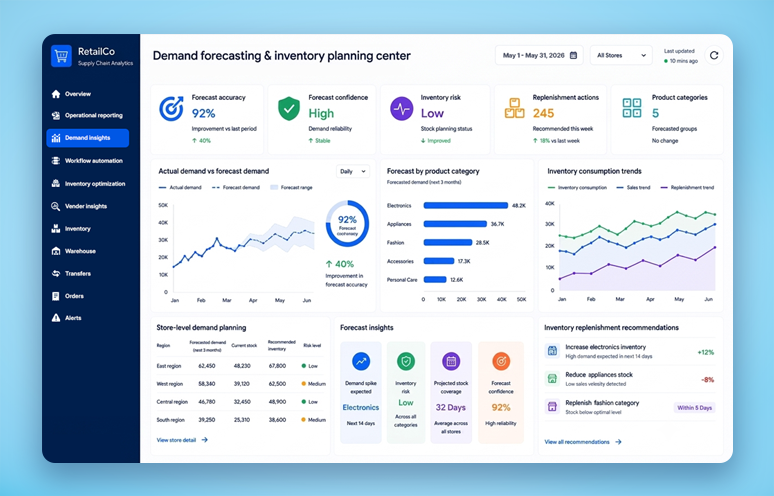
Power BI transforms detailed production data into intuitive interactive dashboards that update in real-time. Having this real-time view enables operations teams to focus on action on the largest opportunities with ease and immediately spot performance issues. Managers can immediately address problems as they occur instead of waiting for end-of-shift or weekly reports to find out about them.
- Comprehensive data integration
Nearly any data, whether PLC, SCADA, ERP, or even manual input utilized by your manufacturing environment, is likely integrated by Power BI. Therefore, it is feasible to view your whole picture of manufacturing performance without information silos.
- Powerful analytical capabilities
In addition to the basic calculations of OEE, Power BI provides powerful analysis through:
-
- Drill-down functionality so that users can dig into daily OEE by shift
- Automatic detection of key loss drivers
- Relative comparison between machines, shifts, and product lines
- Historical performance trends to analyze improvement metrics
- Predictive analysis to predict possible equipment failure
- Accessibility and collaboration
Power BI dashboards can be accessed from any device with the right security credential, hence enabling all employees ranging from shop floor supervisors to the management level to share and utilize the same reliable source of data. This transparency will motivate problem-solving across functions and coordination of aligned efforts.
- Scalability
Whether you are tracking OEE on a single production line or across many sites globally, Power BI easily scales to meet your requirements. This guarantees, at the enterprise level, that your OEE tracking solution will expand with your company.
Make smarter decisions with real-time dashboards and reports.

Turn the potential of your business data into performance gains
Incorporating OEE with Power BI provides a powerful platform for driving efficiency, quality, and decision-making improvements in manufacturing. It brings transparent, real-time insights into the way equipment is operating, where losses are occurring, and how to take actions to produce better outcomes. It enables continuous improvement by converting raw production data into valuable information utilized by teams on a daily basis.
OEE is a tool for unlocking smarter ways of working. Power BI’s easy-to-use dashboards and visual reports help manufacturers gain the ability to spot trends, respond quickly to issues, and make data-driven decisions. To learn more about how integrating Power BI with your manufacturing operations can help improve OEE, talk to our data experts.