Business intelligence consulting services
We help leaders get from data collection to business impact quickly by unifying systems, automating reporting, and gathering reliable insights.
Talk to a BI expertWe help leaders get from data collection to business impact quickly by unifying systems, automating reporting, and gathering reliable insights.
Talk to a BI expertOur Clients

Business intelligence is a data analysis process that helps leaders get a comprehensive view of their business operations. It uses technologies, applications, and practices to find relevant data and analyze it. The insights are then visualized through reports and dashboards to support strategic decision-making processes. Our BI solutions are designed to improve operational efficiency, increase profitability, and identify growth opportunities. They provide real-time dashboards, automated reports, and data visualization to support strategic planning and decision making. In the last 20 years, we’ve developed 200+ BI systems. Our clients have improved customer experiences, optimized processes, forecast outcomes, and identified growth opportunities. To build the right BI system for your business, talk to our BI consultant.

We help enterprises build centralized BI ecosystems across departments using platforms such as Microsoft Power BI, SAP BusinessObjects, and Qlik. Some of our services include data warehouse strategy, KPI standardization, and governance setup.

We design end-to-end BI architectures using cloud platforms like Azure Synapse, Amazon Redshift, and Google BigQuery. Additionally, we optimize ETL processes to improve data refresh speeds and reporting accuracy.

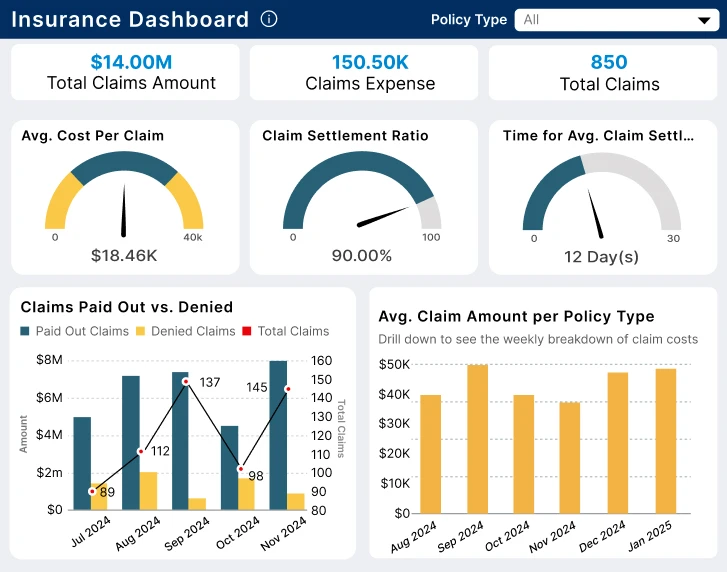
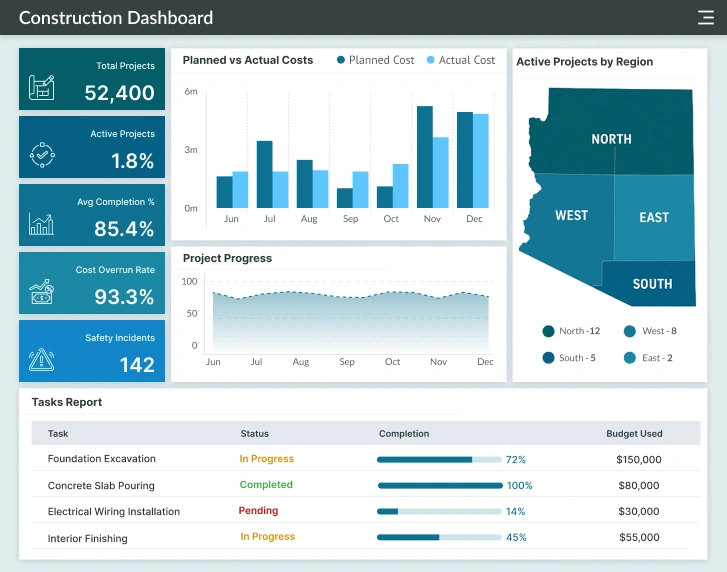
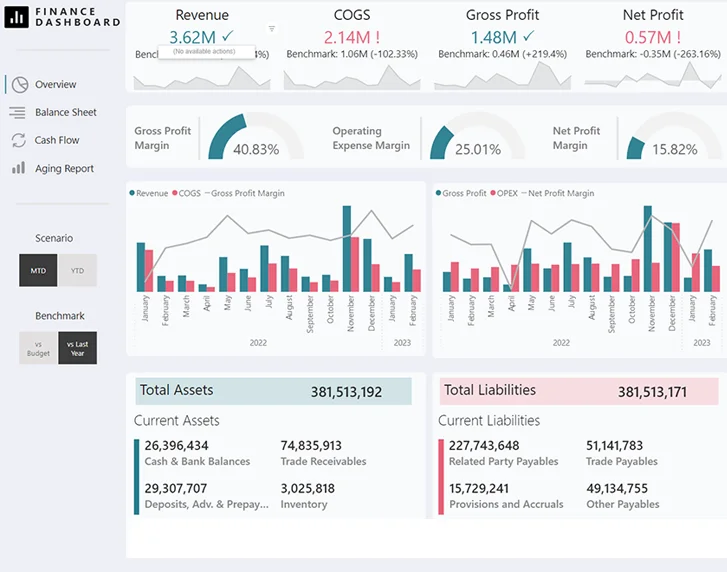
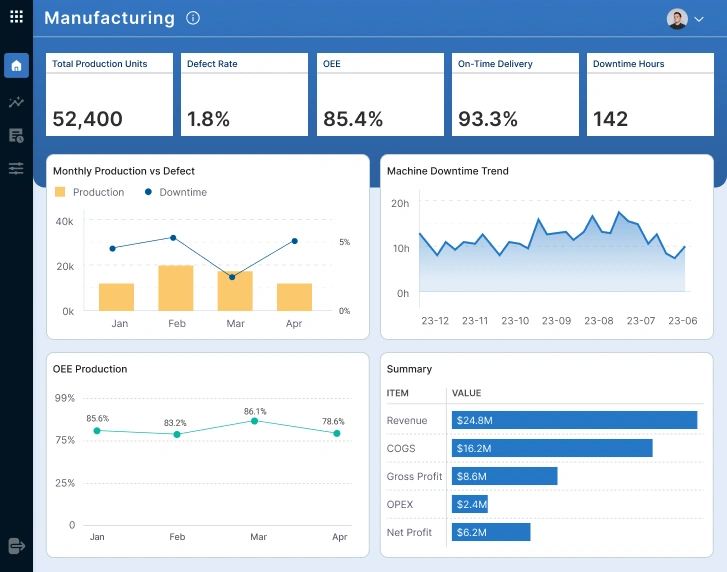
We build interactive dashboards in Power BI, Tableau, and Looker customized for roles like sales managers, finance leads, and operations managers. Our reports have advanced functionalities for ease of use; some of them include automated scheduling, drill-down options, and mobile access for on-the-go insights.

We embed BI dashboards and reports directly into your CRM, ERP, or SaaS applications using the mainstream tools like Power BI Embedded and Tableau Embedded Analytics. It gives users seamless, in-context data access without switching platforms.

We provide ongoing support so that you can make the best of your BI system. It includes data integrity checks, dashboard enhancements, and version upgrades. Additionally, when you add more users or new data sources, we enhance your BI solution so that it grows with your business.

We design tailored BI solutions that align with your unique business requirements, systems, and industry. From custom dashboards and ETL pipelines to predictive analytics and advanced reporting, we turn complex data into clear, actionable insights.
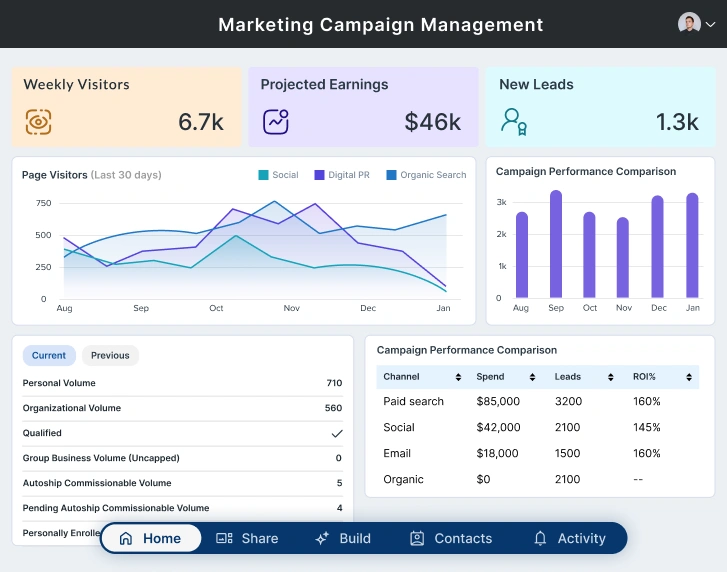
Business intelligence for marketing
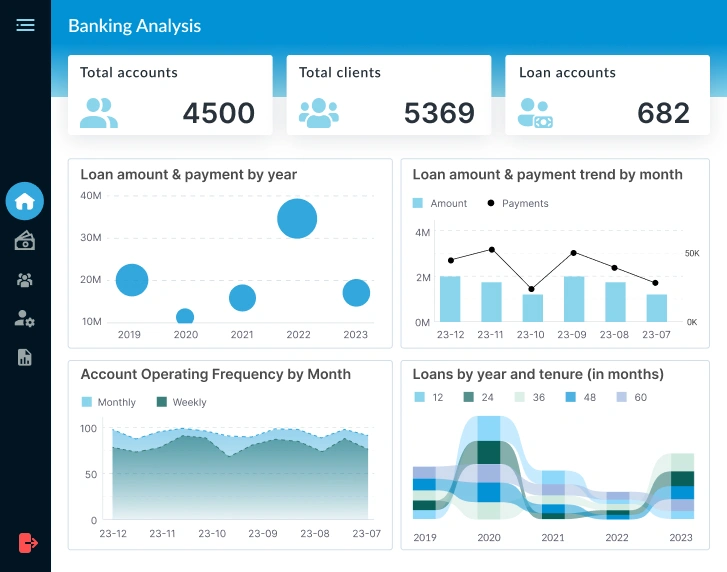
Business intelligence in banking
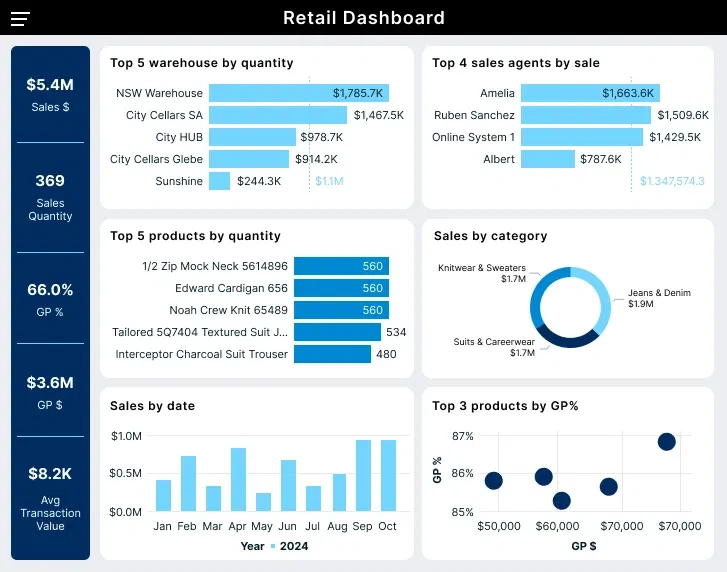
Business intelligence in retail
Business intelligence in healthcare

Business intelligence in insurance
Business intelligence in construction
Business intelligence in financial
Business intelligence in manufacturing
Business intelligence in semiconductor

Business intelligence in supply chain

Business intelligence in telecom

200+
BI consulting projected delivered
345+
BI dashboards designed
120+
BI professionals on board
10+
Years of experience in BI consulting

Expertise in BI tools and technologies
BI consultants bring in-depth knowledge of platforms like Power BI, Tableau, Qlik, and more. Therefore, they can help you choose the right tools and technologies for your business needs.
Faster implementation and ROI
They bring experience and proven frameworks that can speed up BI deployment. You can start receiving strategic business insights faster and their value much sooner.
Avoid costly mistakes in BI implementation
Their experience can help you prevent missteps in the entire process from tool selection to deployment because if BI is implemented incorrectly, it can cost you time, money, and resources.
Gain value from underused data
Consultants help find hidden patterns and trends in your existing data. You can use the unused information and turn it into a competitive advantage.
Gain an outside perspective
BI consultants bring fresh and unbiased insight into your business processes. They can help you identify inefficiencies, which you and your teams might not see internally.
Bridge the gap between IT and business teams
BI consultants turn technical data into business-friendly formats. For example, for your sales team, CRM data dashboards to view monthly lead-to-sale conversion rates.
Change management and user training
BI consultants help onboard teams, ensure user adoption, and offer training. They can help your staff independently explore and use data effectively.
Stay aligned with best practices and compliance
BI consultants stay updated on the latest data governance, security, and compliance standards. Therefore, they can help you reduce data risks and improve trust in your information.
Build a smarter, faster path from data to decisions with expert help. Our BI consultants design results-driven BI solutions that align with your goals and bring tangible business benefits.
We work with stakeholders to identify key business objectives, challenges, and metrics. It helps us set a clear foundation for your BI strategy.
Then, we assess all available data sources such as ERPs, CRMs, cloud apps, and spreadsheets. And plan how to unify them for complete information visibility.
We build the right architecture (data warehouses/lakes) and structure your data into models that support accurate, flexible reporting.
We then automate the flow of data from raw sources to cleaned, structured datasets. They ensure that all the data is trustworthy and analysis-ready.
We design role-specific, department-specific dashboards and reports. Depending on your data, we use tools like Power BI, Tableau, and Qlik.
We ensure data accuracy, performance, and alignment with your business goals through end-to-end testing.
We deploy your BI solution and train end users to explore, interact with, and trust their data.
We monitor adoption and performance, gather feedback, and continuously enhance your BI solution so that it grows at the same pace as your business grows.
20+ years of experience in data science, warehouse, BI, and analytics
Certified BI experts skilled in Power BI, Tableau, Qlik, and other leading platforms
Custom BI solutions customized to your industry, business goals, and data landscape
Seamless integration with existing tools and systems to unify data visibility
Real-time, easy-to-understand reports with clear data navigation
BI consulting services help organizations turn scattered data into structured, useful insights. It includes tool selection, data integration, dashboard development, and strategy alignment to support better decision-making.
A BI consultant evaluates your current data setup, defines key metrics, and designs a tailored BI system. They connect your tools and data sources, build interactive dashboards, and ensure your team knows how to use them. Talk to our BI consultant directly to learn everything we can help you with.
The primary purpose of BI is to help decision-makers track performance, identify trends, and act quickly using real-time, accurate data rather than guesswork.
Business intelligence focuses on understanding business performance; tracking trends, spotting opportunities, and identifying problems early by analyzing historical and real-time data.
A BI partner helps you avoid wasted investments and delayed results. They bring in proven frameworks, technical expertise, and industry insights to make sure your BI system delivers measurable business impact.
Yes. BI consultants can help you set up real-time dashboards and alerts by connecting your systems through modern tools like Power BI, Tableau, and Looker so your decisions are always based on current data.
Any data-driven business can benefit from BI consulting, from growing startups to enterprises, in industries like finance, retail, healthcare, manufacturing, logistics, and professional services.
The cost depends on the complexity of your data environment and project scope. Many companies start small with focused dashboards and scale as they see value. When done right, BI pays for itself in efficiency and insight.
Timelines vary. A small BI project might take a few weeks, while enterprise-scale systems can take several months. The key is to plan properly and build in stages if needed.
Costs vary by project size, tools, and level of customization. Some consultants charge hourly, others by project. It’s best to get a tailored quote based on your specific goals and tech stack.
Get maximum value from your data
Your business already has valuable data. We can help you turn it into clarity, confidence, and smarter decisions. Talk to our BI consultants to learn about our processes, tools, and technologies.
 100% Secure. Zero Spam.
By submitting this form you agree with the terms and privacy policy of Softweb Solutions Inc.