The oil and gas industry has to track a huge amount of data in real-time on a regular basis. This includes monitoring of wells in multiple areas which makes it difficult to keep a track of important parameters like production figures, well downtime, production costs, etc. However, Power BI dashboards offer a great solution for the O&G industry to deal with these challenges.
Power BI services for the oil & gas industry help you to put all the key metrics in a central location and make it easy for your team to analyze data. With the help of the Power BI O&G dashboard, you can provide your employees with the information they need to make data-driven decisions. For example, if you want to review the production of oil as per the location, you can easily monitor the dashboard and review it. Simultaneously, you can also track production in the last few months.
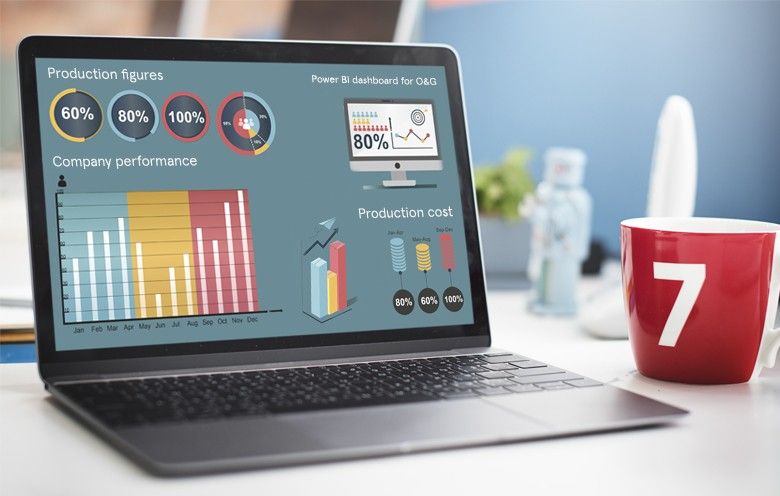
An oil & gas dashboard extracts your core data and provides visual insights into your operation. It provides real-time visibility and insights into the key performance indicators (KPIs).
Challenges faced by the Oil & Gas industry and how Power BI can help to overcome them:
What does the Oil & Gas industry needs?
The oil and gas industry requires high-quality decision-making based on accurate and intuitive data. Production involves the analysis of burdensome and overwhelming amounts of data from numerous data sources and systems at every stage. In oil and gas facilities, cameras and sensors provide high-pace data that must be managed with awareness to match with operations.
Power BI in the Oil & Gas industry
Financial health reports allow users to evaluate production, spending, jobs, service providers, investment groups and much more. The Power BI oil & gas operations dashboard provides insights into production volume and plant maintenance. Onsite users can create, visualize and customize data reports by selecting from a range of:
- Integrated visualizations
- Dashboards and reports
- Monitoring KPIs
- Identifying production optimization opportunities, etc.
Power BI features include personalized dashboards, automated alerts, charts, graphs, gauges and other display options. With the help of these options, you get a clear and concise view of the data, complete with drilling and analysis capabilities.
Power BI functions integrate seamlessly into predictive optimization workflows and help you to explore data visually. It compiles vast amounts of oilfield data from several sources into actionable dashboards and reports.
How Power BI helps the Oil & Gas industry to increase efficiency
Power BI is a Microsoft product that gives business analysts the power of business intelligence and data analysis. It is a comprehensive and robust Microsoft business intelligence system that helps business users with little or no software development experience to create insightful dashboards for most enterprise data. Power BI applications enable oil and gas companies to collect and analyze field data, provide operators with a reporting platform and use key information to help production teams make timely and critical decisions.
The digitization and automation of plants offer producers in the global oil and gas sector the opportunity to increase their efficiency and productivity by gathering performance data from all of their plants. With Power BI, you can easily back up, collect and use in-depth insights about their health and safety data in one place and analyze it as per your requirements.
The roadmap for oil and gas services for digital transformation, which will lead to better customer experience, operational efficiency and optimal financial performance, includes a state-of-the-art cloud ERP integrated with field automation. It also provides better mobile resource management, billing and reporting abilities.
Power BI provides actionable insights and improves decision-making
Power BI enables efficient decision-making by improving your company’s responsiveness. It provides you with a modern business intelligence system along with effective data management techniques. This gives you actionable insights in real-time to enhance decision-making. This increases reliability and predictability and eases the process of decision-making.
Important business benefits of Power BI dashboard for the Oil & Gas industry
- Enhanced reporting
- Secure access to data and analyses
- Automated updates of reports
- Quick identification of causes for trends in the data
- Increased collaboration
Conclusion
When you have the right business intelligence tool in place, you can speed up your decision-making process which was not easy in the past. This not only saves you from losses, but also increases your return on investments.
The Power BI dashboard provides a flexible browser-based platform for scaling up to a scalable user base, data volume and a number of business locations. It is easy and convenient to use for business users even without technical knowledge. To know more about how Power BI reports for oil & gas can help you to improve the performance of your oil & gas plant and increase your company’s growth, talk to our experts.