Model selection in Machine Learning (ML) is the process of choosing the most suitable machine learning model for the specific task. The main challenge in machine learning is recognizing patterns in data and making predictions on unseen data. The ability of a model to do this effectively depends on how well the model has been trained and how successfully it generalizes (the outcome of a model training) to real-world scenarios.
The type of model training, supervised, unsupervised, or reinforcement learning, determines how well the machine learning system will perform. Each type of learning model in machine learning has trade-offs. For example, supervised learning offers precision in outputs but requires labeled data which can be costly and hard to get. Unsupervised learning discovers hidden patterns but lacks precision not ideal for tasks which need specific outputs. Reinforcement learning gives good, bad, or neutral decisions, but requires heavy computational resources and long training times.
Selecting the right machine learning model is not straightforward. It includes data complexity, data quality, interpretability, efficiency, and resource use. And model training involves hyperparameters selection, loss function calculation, parameter optimization, model evaluation, and more. The list does not end there. With experience of two decades in providing machine learning services, we bring you this guide to simplify the process. It highlights easy steps to choose the right training type and shows how to build a machine learning model effectively.
What is a machine learning model?
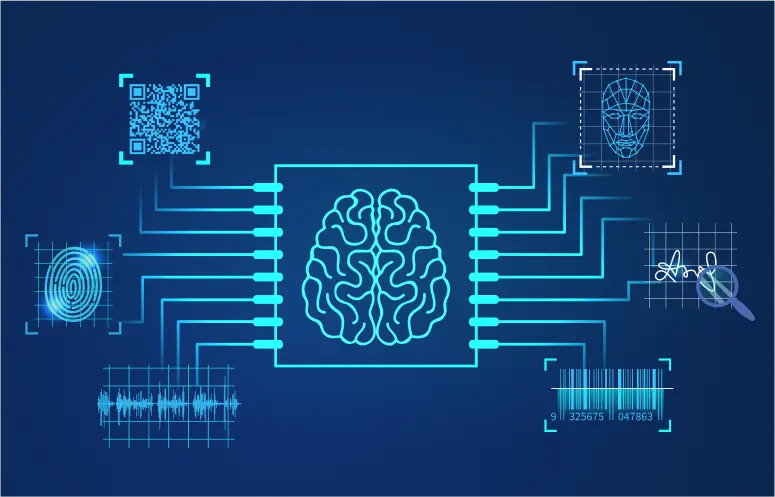
A machine learning model is a trained program that processes input data and generates predictions, classifications, or decisions. It operates without human input for every possible scenario.
For example, in Natural Language Processing (NLP), ML models interpret and identify intent in sentences or word combinations they have never encountered before. We do not need to manually program the model for each new phrase. The model generalizes it from the training data. In image recognition, an ML model can identify objects such as cars or dogs without being explicitly coded for every angle, color, or background. A machine learning model can perform such tasks by having it ‘trained’ on large datasets.
Training a machine learning model means supplying it with data so it can learn from examples and adjust for better accuracy and performance. During this process, the model fine-tunes its internal parameters, such as weights and biases, based on patterns it uncovers and make predictions on new, unseen cases.
What is model training and why is it important?
Model training is the process of optimizing a model’s performance on a dataset of tasks that sufficiently resemble the real-world problems it will be used for. It’s like training an algorithm, for example linear regression algorithm to predict tomorrow’s weather by showing it years of temperature data. It can be complex when you train a model to write stories, create art, or have conversations.
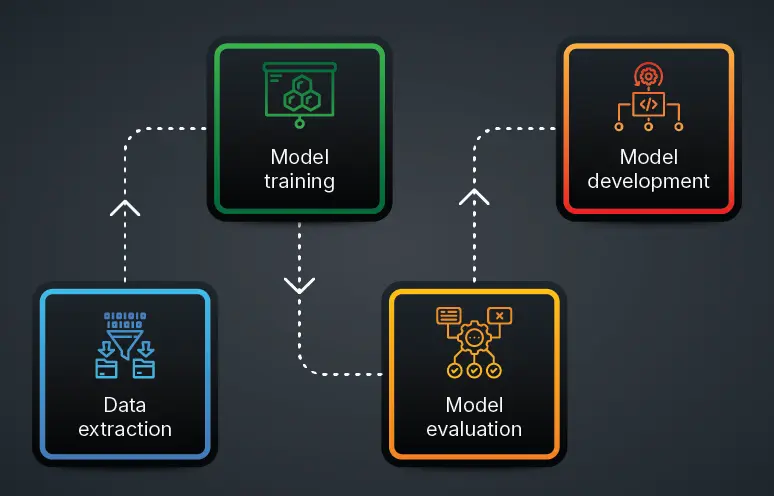
In practice, model training involves the following cycle:

This workflow proceeds iteratively until satisfactory results have been achieved. As IBM’s analysis says, the “garbage in, garbage out” principle remains on top. And that is what machine learning models are built upon with quality data and proper training processes.
What are the types of machine learning models?
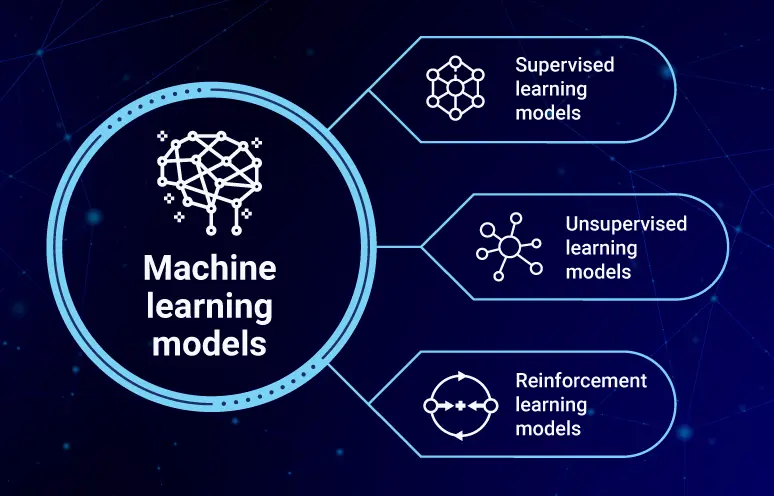
In general, most machine learning techniques can be classified into supervised learning, unsupervised learning, and reinforcement learning. Each type of learning models in machine learning has its unique use cases or training objectives, hyperparameters, algorithms, and training processes.
- Supervised learning is used when a model is trained to predict the “correct” output for an input. It applies to tasks that require accurate output.
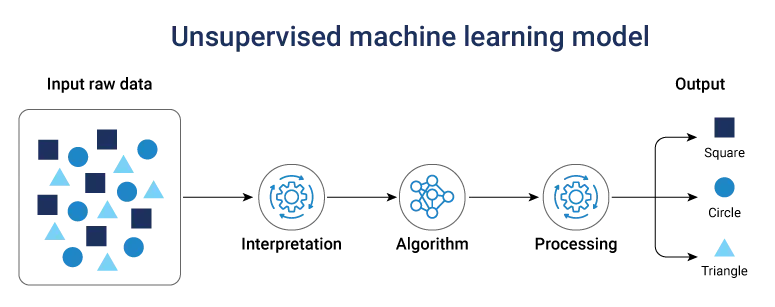
- Unsupervised learning is used when a model is trained to identify patterns and correlations in data. It applies to tasks that require prediction.
- Reinforcement learning is used when a model is trained using many trial and error experiments to evaluate its environment and take the action. It applies to tasks that require decisions.
The end-to-end training process for a given model can involve hybrid approaches that leverage more than one of these types of machine learning models. It is essential knowledge for anyone learning how to create a machine learning model.
For instance, Self-supervised Learning (SSL) can feasibly be classified as both supervised and unsupervised learning, depending on which aspect of those terms’ definitions one focuses on. Semi-supervised learning combines unsupervised and supervised learning.
It is also important to note that an Artificial Intelligence (AI) system can use multiple types of machine learning models. Take an example of Large Language Models (LLMs) used in chatbots. They usually begin with self-supervised pretraining, move through supervised fine-tuning, and improve with Reinforcement Learning from Human Feedback (RLHF).
-
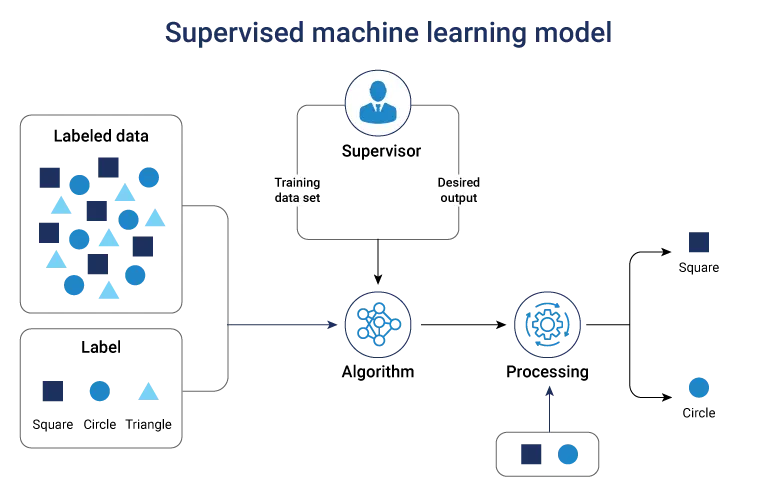
Supervised machine learning models
Supervised ML algorithms learn from labeled training data, where inputs and outputs are provided. They excel at prediction tasks where historical examples guide decisions. These algorithms train models for tasks that require accuracy, such as classification problems like email spam detection and regression tasks like price or demand forecasting.

For example, American Express has trained their ML model with millions of labeled transactions to differentiate genuine spending and fraudulent activity.
Below are some popular classification and regression algorithms that fall under supervised learning models in machine learning:
- Linear Regression establishes relationships between variables using straight-line mathematical functions. It is ideal for predicting continuous numerical values like sales forecasts or price estimations.
- Logistic Regression handles binary classification problems. It predicts probabilities for yes or no decisions, perfect for spam detection and medical diagnosis scenarios.
- Decision Trees create hierarchical decision structures that mirror human reasoning processes. They are useful for credit risk assessment, customer segmentation, and decision support systems.
- Random Forest combines multiple decision trees to increase accuracy and reduce overfitting. It works well for applications such as fraud detection, recommendation systems, and for any forecasting engines.
- Naive Bayes applies probabilistic reasoning based on feature independence assumptions. It’s powerful for sentiment analysis and document categorization tasks.
- Support Vector Machines (SVM) find boundaries between classes in high-dimensional data. They excel at classification problems. They are applied in image recognition, handwriting analysis, and bioinformatics classification tasks.
- Gradient Boosting (XGBoost, LightGBM) builds models sequentially. The model corrects previous errors with each iteration. It is ideal for ranking problems, customer churn prediction, or real-time risk modeling.
- K-Nearest Neighbors (KNN) makes predictions based on similarity to nearby data points. It is effective for recommendation systems and pattern recognition tasks.
-
Unsupervised machine learning models
Unsupervised learning method train ML models to identify hidden patterns in unlabeled data. They are effective for exploratory analysis, segmenting customers, and detecting anomalies where predefined results cannot be given.

Netflix, for instance, applies clustering methods to group viewers according to their watching patterns. That’s how Netflix powers personalized recommendations using what are models in machine learning techniques.
Most unsupervised learning methods perform one of the following functions:
- Clustering algorithms organize unlabeled data into groups based on similarity to one another in data points. They are useful in applications like customer segmentation or fraud detection where pattern recognition is the key. K-means, Gaussian Mixture Models (GMMs), and density-based methods like DBSCAN are popular clustering methods.
- Association algorithms uncover relationships between actions and conditions within large datasets. For instance, e-commerce businesses such as Amazon use association models to suggest products that customers often buy together.
- Dimensionality reduction algorithms compress datasets into fewer variables while preserving important information. This process eases preprocessing and supports applications such as data visualization and compression. Examples include Principal Component Analysis (PCA), Linear Discriminant Analysis (LDA), autoencoders, and t-SNE.
-
Semi-supervised machine learning models
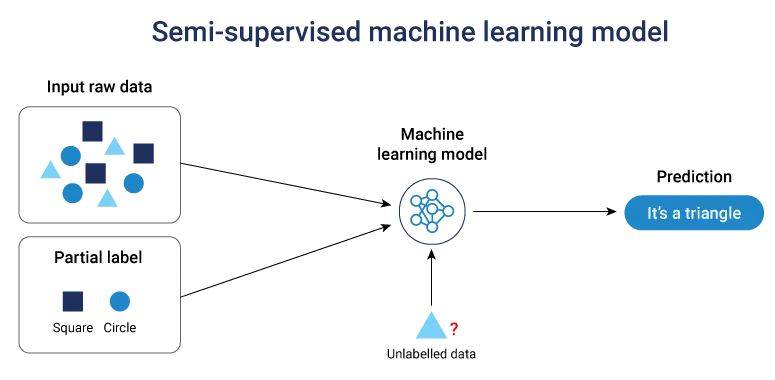
Semi-supervised learning uses a small set of labeled data with a larger pool of unlabeled data. This approach is ideal when labeled data is limited but unlabeled data is plentiful. It develops accuracy without requiring the costly labeling of data points.

For example, Google Search enhances ranking algorithms with semi-supervised techniques. This works by combining small labeled datasets with billions of unlabeled web pages, showcasing what are models in machine learning capabilities in real-world applications.
- Self-training iteratively grows the training dataset by using the model’s most confident predictions on unlabeled data.
- Pseudo-labeling temporarily tags unlabeled data with labels. This approach allows examples to be included in training to enhance model performance.
-
Reinforcement machine learning models
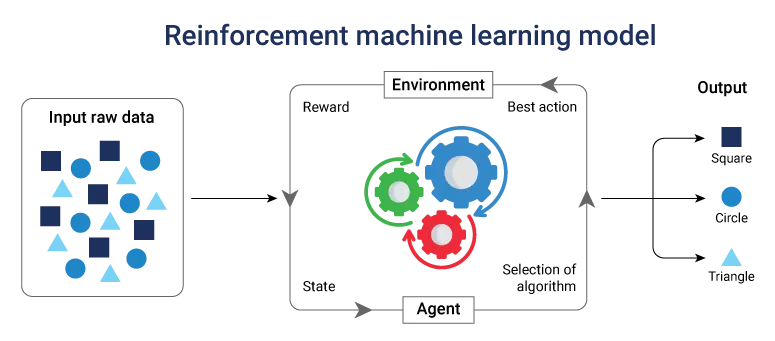
Reinforcement learning is about experience and feedback. An “agent” learns by interacting with an environment and receiving rewards or penalties based on its actions. Slowly, it adopts strategies that yield the highest rewards.

For example, DeepMind applied reinforcement learning in AlphaGo. The system learned to play Go with superhuman skills not by strategies. It improved by playing millions of games and learning from experience.
- Agent, Environment, Reward framework where agents take actions in environments and learn from resulting rewards or consequences.
- Q-Learning learns optimal action-value functions for decision-making in discrete environments with well-defined states and actions.
- Deep Q Networks (DQN) combines deep learning with Q-learning to handle complex environments with high-dimensional state spaces.
- Policy Gradients (REINFORCE, PPO) optimize action policies to maximize expected rewards. It is effective for continuous action spaces.
- Monte Carlo Tree Search (MCTS) balances exploration in game-like scenarios. It is used in AlphaGo and similar strategic applications.
-
Deep learning models

Deep learning uses multi-layered neural networks, rather than traditional machine learning, to model complex patterns. Inspired by the human brain, neural networks consist of interconnected layers of nodes (neurons), each performs its mathematical operation called an activation function. These nonlinear functions pass outputs from one layer to the next and enable the network to capture complex patterns and dependencies.
- Convolutional Neural Networks (CNNs) excel at image processing and computer vision tasks. They recognize spatial patterns through specialized layers.
- Recurrent Neural Networks (RNNs) handle sequential data like time series and natural language by maintaining memory of previous inputs.
- LSTM/GRU variants of RNNs solve the gradient problem. They enable learning from longer sequences and complex temporal patterns.
- Transformers (BERT, GPT) revolutionized NLP through attention mechanisms, understanding context, and relationships across entire sequences simultaneously.

What are the applications of machine learning models across industries?
Across industries, organizations are harnessing machine learning models to tackle complex problems and create new opportunities.

- In manufacturing, predictive maintenance models help prevent equipment breakdowns and optimize production schedules. Computer vision-powered quality control systems detect defects that human inspectors might overlook, ensuring consistent product standards.
- Semiconductor companies employ yield optimization models that analyze thousands of process parameters to improve chip production success rates. These systems reveal subtle correlations between manufacturing conditions and final product performance.
- In healthcare, diagnostic models analyze medical images, predict patient outcomes, and suggest personalized treatment plans. Machine learning also accelerates drug discovery by identifying promising compounds and optimizing clinical trial designs.
- Financial institutions rely on risk assessment models for loan approvals, algorithmic trading systems for investment decisions, and fraud detection algorithms capable of processing millions of transactions in real time.
- Energy companies use demand forecasting models to enhance grid operations, predictive maintenance for infrastructure, and exploration algorithms to pinpoint promising drilling sites.
- In telecommunications, network optimization models manage traffic loads, customer churn prediction systems flag at-risk accounts, and recommendation engines suggest relevant services to subscribers.
What are the differences between ML model learning approaches?
Understanding when to apply different learning methods helps you select the most effective approach for specific challenges.
| Aspect | Supervised learning | Unsupervised learning | Reinforcement learning |
|---|---|---|---|
| Data requirements | Labeled examples required | No labels needed | Environment feedback only |
| Primary goal | Predict known outcomes | Discover hidden patterns | Optimize decision-making |
| Example applications | Classification, regression | Clustering, dimensionality reduction | Game playing, robotics |
| Training approach | Learn from correct answers | Find structure in data | Learn from trial and error |
| Evaluation methods | Compare predictions to known results | Internal validity measures | Cumulative reward optimization |
This comparison provides a foundation for selecting the appropriate learning method based on available data and desired outcomes.
What is the right machine learning model for your task?
Choosing between supervised, unsupervised, and reinforcement learning depends on your data characteristics and business objectives.
-
Deploy supervised learning when:
- Historical examples with known outcomes exist for training
- Prediction accuracy on similar future cases is the primary goal
- Clear success metrics can be defined and measured
- Sufficient labeled data is available for model training
-
Choose unsupervised learning when:
- Exploring data to discover unknown patterns or structures
- Limited or no labeled examples are available
- Customer segmentation or anomaly detection is the objective
- Understanding data relationships is more important than prediction
-
Implement reinforcement learning when:
- Sequential decision-making is required with delayed feedback
- Optimal strategies must be learned through interaction
- Traditional rule-based approaches are insufficient for complexity
- Long-term reward optimization outweighs short-term accuracy
What should you consider when selecting a machine learning model?
If you are ready to kick off AI-driven automation but unsure which machine learning algorithm best suits your needs, this quick reference guide can help you decide. It outlines which approaches work best depending on your goals and challenges.
Quick recommendations
- Fast decision-making: Consider Decision Trees or Random Forests
- High-accuracy predictions: Go with Neural Networks or XGBoost
- Clarity and explainability: Choose Logistic Regression or Decision Trees
- Working with images or text: Use CNNs, RNNs, or Transformers
- Adapting in real time: Explore reinforcement learning
For a deeper look, here are the practical scenarios to help match your goals and requirements with the right machine learning model.
| Goal | Best algorithm match | Example algorithms | Business use cases |
|---|---|---|---|
| Predict continuous values such as revenue or demand | Supervised learning (Regression) | Linear Regression, Decision Trees, Random Forest, XGBoost | Sales forecasting, stock price prediction |
| Categorize data into predefined classes | Supervised learning (Classification) | Logistic Regression, SVM, Random Forest, Neural Networks | Spam detection, fraud detection, churn prediction |
| Group similar data points without labels | Unsupervised learning (Clustering) | K-means, Hierarchical Clustering, DBSCAN | Customer segmentation, market research |
| Reduce complexity while keeping key patterns | Unsupervised learning (Dimensionality Reduction) | PCA, t-SNE, Autoencoders | Feature selection, anomaly detection |
| Learn and adapt in dynamic environments | Reinforcement Learning | Q-learning, Deep Q-Networks (DQN), PPO | Robotics, game AI, automated trading |
| Process complex unstructured inputs like text, images, or speech | Deep Learning | CNNs (for images), RNNs (for sequences), Transformers (for text) | Image recognition, NLP, voice assistants |
What mistakes should businesses avoid when selecting ML models?
Even with solid knowledge of AI and ML development, many organizations face difficulties when it comes to choosing the right algorithm. Below are five common pitfalls you will want to steer clear of:
- Overlooking data quality: If the data is messy or incomplete, even the best models will produce weak results.
- Adding unnecessary complexity: Bigger models aren’t always better; simpler ones are often easier to manage and just as effective.
- Ignoring scalability: Models must be able to handle future growth in data and usage.
- Skipping goal alignment: Without clear business objectives, model selection becomes guesswork.
- Failing to evaluate alternatives: Relying on the first model that works may mean missing out on better-performing options.
What is the next step once a machine learning model is chosen?
Selecting a machine learning model is only part of the journey. The next step is understanding how to deploy a machine learning model into production, aligning it with business objectives, and maintaining its performance as data and market conditions evolve. Without the right expertise, models can quickly lose relevance, leading to wasted investment and missed opportunities.
This is where our team can help. Along with ML model development, we bring expertise and experience in model implementation, monitoring, and optimization, ensuring the ML model delivers measurable business value from day one. Whether you need guidance on integration, scaling, or continuous improvement, we are ready to work alongside you.
Frequently Asked Questions
1. What is an algorithm in machine learning?
A machine learning algorithm is a set of mathematical instructions that enables computers to learn patterns from data. It defines the learning process, optimization methods, and prediction mechanisms. Common algorithms include decision trees, neural networks, and clustering techniques that solve specific types of problems.
2. What is the difference between a machine learning algorithm and a machine learning model?
An algorithm is a mathematical procedure or method, while a machine learning model is the result after training the algorithm on data. The algorithm remains constant, but each trained model contains unique parameters learned from specific datasets, making predictions based on that training.
3. Which ML algorithm is best for prediction?
No single algorithm excels universally. Random Forest and Gradient Boosting often perform well across diverse prediction tasks. Deep learning models excel with large datasets and complex patterns. The optimal choice depends on data size, complexity, interpretability requirements, and computational resources available.
4. How to apply ML algorithms?
Start by defining your problem clearly and preparing clean, relevant data. Choose appropriate algorithms based on problem type and data characteristics. Train models using historical data, validate performance with testing datasets, then deploy successful models to production environments for real-time predictions.
5. What is the difference between AI and ML models?
AI models encompass all artificial intelligence approaches, including rule-based systems and expert systems. ML models specifically use statistical learning from data to make predictions. Machine learning represents a subset of artificial intelligence focused on pattern recognition and predictive capabilities.