Data dashboard development services
Our data solutions turn complex data into clear, actionable intelligence.
Get free consultationOur data solutions turn complex data into clear, actionable intelligence.
Get free consultationOur Clients
Data only becomes valuable when it’s easy to understand and utilize. A well-designed dashboard can turn raw numbers into clear, practical insights. We help businesses transition from static reports and scattered spreadsheets by building dashboards that update in real-time. Whether it’s a cloud-based system or an interactive executive dashboard, we customize each solution to help you meet your business goals and day-to-day operations.
Inventory dashboard
Monitor stock levels across multiple warehouses in a single view
Track product movement and identify slow- or fast-moving items
Set reorder alerts to avoid stockouts or overstocking
Visualize demand trends to support seasonal and long-term planning

Finance dashboard
Visualize income, expenses, and profitability in one place
Track budget allocations vs. actual spend across departments
Monitor KPIs like current ratio, ROE, and net profit margin
Support audits and reporting with accurate, real-time data

Banking dashboard
Analyze customer spending behavior and segment activity
Monitor large or unusual transactions to flag potential fraud
Track deposits, withdrawals, and loan performance
View branch-wise performance and customer service stats
Improve cross-sell efforts by spotting product usage trends

Manufacturing dashboard
Monitor line performance and machine-level output in real time
Analyze downtime reasons and track OEE across shifts or plants
Visualize production throughput, scrap rates, and rework trends
Compare performance across product lines, batches, or facilities
Align maintenance, supply chain, and staffing to actual production needs

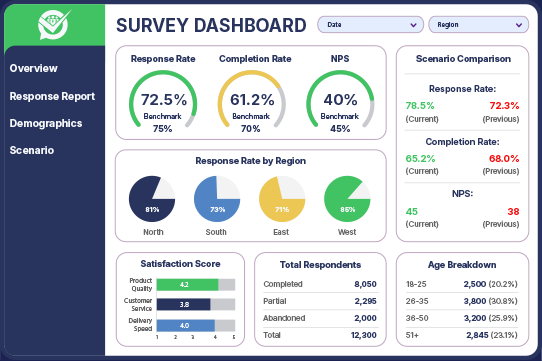
Survey dashboard
Display responses in charts, heatmaps, or comparison views
Track completion rates across segments and time frames
Highlight recurring feedback themes with sentiment analysis
Filter responses by demographic, geography, or question type
Export insights for presentations or strategic planning
Every organization approaches data differently, and the services behind it must be tailored accordingly. Explore how to align data goals with the right analytics capabilities, whether you're scaling insights or starting from scratch.

We offer strategic consulting services to help you define your dashboard vision, align it with business objectives, and plan the right architecture for long-term success. We strategize your dashboard development to be insightful, scalable and future ready. We guide you in identifying key metrics and visualization techniques that drive meaningful decision-making process.

Our services involve the creation of a customized solution to cater to your specific business requirements. We analyze your requirements in-depth to design a suitable solution for your business. Our experienced software developers utilize the best practice to make it easy to use and visually engaging and provide unique, maximum-relevant functionality for your situation.

Our dashboard integration help you monitor, manage, and visualize important business metrics and Key Performance Indicators (KPIs) in a user-friendly format. We utilize software applications and technologies such as data warehousing, business intelligence, and third-party dashboard software including Power BI, Tableau, Google Looker Studio, Qlik, and Grafana to gather, process and display information in actionable, decision-ready formats.

Our API integration services enable real-time data synchronization across multiple platforms, creating a unified view of critical metrics and indicators. We integrate the necessary sources of data to compile further visualization using graphs, charts, and tables, empowering your team with fast, actionable insights. From CRMs to cloud apps, we ensure your data flows smoothly and stays connected where it matters most.

We develop cloud-based dashboard hosted on a remote server for scalability, accessibility, and data storage. This dashboard helps users with real-time data analysis, remote access, and cost-efficient management while ensuring data security and compliance. Access insights anytime, anywhere with security and scalability built in from day one.

Our services enable visual representation of data that facilitates easier understanding, study, and proper decision-making. Our dashboards convert complicated and large amounts of data into simple, clear, and implementable information. With graphs, charts, maps, and dashboards, it becomes easier to understand data. This helps spot patterns, trends, risks, and correlations in your data for more informed decision-making.

Speed and responsiveness are of utmost importance for high-performance dashboards. We assist you to improve loading time, responsiveness, and overall effectiveness by optimizing data queries, visualization rendering, and resource use to provide a seamless user experience. We fine-tune every layer, so your dashboard performs well and stays updated.

Dashboard support and maintenance services are an important part of our services. We maintain your dashboard and assist you in optimizing its usage. We ensure that your dashboard runs efficiently, stays up to date, and delivers correct and pertinent information to users. Periodic performance and operation monitoring are built into its long-term functionality, security, and value.

We design and develop a digital dashboard that remains relevant and adapt or evolve to continuously meet new challenges, incorporate new functionalities or calculations, while retaining overall dashboard performance. Your dashboard grows with your business, flexible, future-ready, and always aligned with your goals.
We build dashboards that help you make smarter, faster decisions. Whether you need real-time updates, custom KPIs, or seamless integrations, our team is here to bring your vision to life. Start your dashboard journey with us today.
Talk to Our Data ExpertsDashboards serve different roles depending on who’s using them and why. It is important to know which dashboard types are best suited for your business objectives, users, and data environment.
Analytical dashboards offer information based on large amounts of data and past performance, enabling decision-makers and data experts to see information, spot trends, and predict future trends. They unite historical and real-time data through advanced visualizations to support deeper, data-driven analysis.
Operational dashboards help companies track and improve the efficiency of everyday business processes by measuring real-time data against the key metrics and KPIs. These dashboards can be personalised for different departments and job functions. They are required to detect breaks in a company’s workflow and should be refreshed regularly.
Tactical dashboards are utilized to track all the operational processes that are aligned with the strategic objectives of a business. These dashboards generally provide more visualization compared to operational dashboards and facilitate the bridging of strategic planning and operational enactment.
Strategic dashboards are associated with the measurement of the effects of long-term business strategies based on KPIs for business performance. In contrast to operational dashboards, which are accessed at different organizational levels and refreshed regularly, strategic dashboards are mainly accessed by high-level executives to chart progress over time, analyze a company’s path, and lead to system-wide improvements.
Executive dashboards present one, live view of Key Performance Indicators (KPIs) and other crucial business data to senior management. They allow leaders to make quick decisions regarding the overall business performance, identify trends, and make sound, fact-driven decisions. Executive dashboards are meant to be easy to use and flexible, enabling executives to track many different aspects of the company, ranging from sales and marketing to finance and operations.

Drill-down capabilities
Our dashboards enable exploration of high-level metrics and drill into detailed insights, helping you uncover patterns, spot issues, and act faster.
Real-time data sync
Your data updates in real time, so you’re always working with the latest numbers, no manual refreshes, no waiting around. Perfect for tracking live sales, operations, or customer behavior.
Mobile-friendly dashboards
Whether you’re in the office or on the move, your dashboards go with you. We design dashboard that are compatible with all sorts of devices so teams in the field or remote decision-makers always stay updated.
Role-based access
Keep data secure and relevant. We set up role-based access, so everyone can see exactly what they need, as and when they require.
Predictive analytics
With predictive models built in, your dashboards can find trends, alert you to risks, and help you plan smarter.
Integration with existing data sources
We connect your dashboards to the systems you already use such as CRMs, ERPs, databases, and more, bringing all your insights into one place.

Our dashboard development services bring information together from various sources, offering leadership and teams a clear, centralized picture of operations, performance, and strategy in one place.
Stakeholders can monitor key metrics in real time using our live dashboards and adjust strategies promptly to capitalize on new developments.
Our analytics dashboard development ensures you can monitor real-time progress against goals, quickly identify deviations, and take corrective action without delay.
Embedded dashboards accessible across departments ensure that executives and frontline staff share performance metrics, maintain accountability, and work together toward measurable targets.
Our custom dashboard solutions automate the data collection, processing, and presentation processes, freeing up your analysts and decision-makers to focus on what matters using data.
Whether it's a drop in production, a spike in customer complaints, or an unexpected cost overrun, our dashboards act as an early warning system to keep your operations on track.
Industry
Telecom
Technologies
Master Data Portal, ERP Systems, Data Integration, Reporting Tools
Challenges
Business impact
Client
A top-tier US telecom company
The right tech stack doesn’t just support your dashboard, it defines its scalability, speed, and adaptability. Here’s a look at the tools and platforms we trust to bring powerful dashboards to life.


Building a great dashboard is about purpose, design, and relevance. These practical tips ensure you achieve maximum value from your data interface.
10+ years of experience in creating data visualization solutions across industries
60+ experts in Tableau, Power BI, and Logi Analytics for data visualization and transformation
350+ dashboards created using Power BI and Tableau for better insights
Intuitive interfaces for non-technical users with Power BI and Tableau
Adherence to governance and compliance for enterprise environments with Looker and Power BI
A data analytics dashboard is a visual interface that displays key metrics, trends, and performance indicators in one place. It helps businesses monitor, analyze, and act on their data more efficiently by turning raw numbers into clear, actionable insights.
Yes, we can integrate dashboards with your current systems, databases, and tools. Whether you use cloud platforms, ERPs, CRMs, or legacy software, we ensure seamless connectivity, so your data flows directly into the dashboard without disruption.
The timeline for developing a custom dashboard depends on three things – the project’s complexity, data sources, and specific requirements. It can take from a few weeks to a couple of months to deliver a fully functional and user-friendly solution. To discuss your project, connect with our data experts.
Yes, we specialize in real-time dashboard development. These dashboards continuously update as new data becomes available, giving you live insights and enabling faster, more informed decision-making.
A report typically presents static, historical data in a structured format, used for audits or summaries. A dashboard, on the other hand, is interactive and dynamic, offering real-time updates and visual insights that help monitor performance and respond quickly.
Yes, we work closely with your team to understand your business goals and processes, then help define and prioritize the most meaningful KPIs for your dashboard. Our goal is to ensure you’re tracking what matters most.
Yes, we provide user training and comprehensive documentation to help your team confidently use and manage the dashboards. Whether it’s a walk-through session or a detailed user guide, we make sure you’re well-supported.
Yes, data security is a top priority in all our dashboard development services. We follow best practices in data encryption, user authentication, and access control to ensure your information remains safe and protected.
KPI dashboards are focused dashboards that track and display your key performance indicators in real time. They help you stay aligned with business goals by offering a quick view of what’s working and where attention is needed.
Data visualization refers to individual charts, graphs, or visuals that represent data. A dashboard is a collection of these visualizations organized into one interface, giving users a broader view of performance and trends in one place.
A performance analytics dashboard tracks metrics related to business, operational, or team performance. It helps organizations measure efficiency, identify gaps, and make improvements based on real-time or historical data insights.
From scattered data to seamless dashboards - transform how your team makes decisions.
Empower every decision with real-time data that’s clear, timely, and actionable.
 100% Secure. Zero Spam.
By submitting this form you agree with the terms and privacy policy of Softweb Solutions Inc.