Power BI Overall Equipment Effectiveness (OEE) dashboard
Make decisions driven by data for improved equipment efficiency
Talk to our Power BI expertsMake decisions driven by data for improved equipment efficiency
Talk to our Power BI expertsOur Clients
Companies using OEE dashboards report a 10-30% improvement in equipment utilization by identifying and addressing inefficiencies in real time. With overall equipment effectiveness (OEE) operation dashboards, you can enhance the overall productivity of machines in the manufacturing industry by visualizing performance data in real-time.

Our Power BI experts can help you monitor and track equipment performance trends, enabling you to:

With Power BI OEE dashboards, you can monitor production inputs and outputs efficiently while identifying:

Our Power BI professionals can help you to reiterate the success of the highest performing plant, enabling you to:

Measuring the efficiency of a company’s equipment can help us understand how well it manages its operations. You can identify the areas that need improvement to reach 100% operational efficiency with the help of our Power BI OEE dashboard.
Data analytics in manufacturing transforms how businesses address downtime and optimize production. Power BI reports help companies gain deep insights into equipment performance and production trends, enabling them to identify and mitigate the root causes of downtime.


Manufacturing analytics offers real-time insights into equipment efficiency, tracking uptime, output, and cycle times. It helps teams quickly identify and resolve bottlenecks, optimize performance, and reduce downtime.

Monitor production quality metrics, identify and address quality issues early, and reduce defects and rework with customized Power BI dashboards.

Maximize return on investment by optimizing equipment performance and extending its useful life, resulting in higher efficiency and profitability.

Lower repair costs by detecting issues early and preventing major breakdowns, thus reducing the frequency and severity of repairs.

Anticipate equipment failures before they occur, allowing for timely interventions that prevent unexpected breakdowns and reduce maintenance costs.

Improve manufacturing output by optimizing equipment usage, performance, and quality, leading to higher overall productivity.

Minimize unplanned equipment failures by tracking and analyzing downtime patterns, enabling proactive maintenance and quick resolution.
Industry:
Manufacturing
Technologies
Power BI, Snowflake
Challenges
Business impact
Client
A leading baby products manufacturer

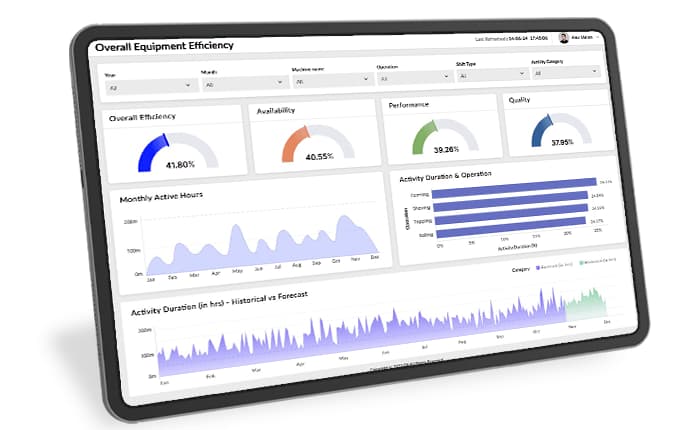
An overall equipment effectiveness (OEE) dashboard is a visual tool that provides real-time insights into the performance of manufacturing equipment. It tracks key metrics such as availability, performance, and quality to measure and improve overall equipment effectiveness. The dashboard consolidates data into an easy-to-read format, helping manufacturers identify inefficiencies, monitor machine performance, and make data-driven decisions.
An OEE dashboard is essential for businesses seeking to enhance operational efficiency and productivity. By providing real-time visibility into equipment performance, it helps identify and address issues such as downtime, performance losses, and quality defects. This leads to improved productivity, reduced costs, and optimized resource allocation, ultimately driving better business outcomes and higher profitability.
A manufacturing OEE dashboard captures and analyzes various data points, including:
Make informed decisions through Power BI real-time streaming
Connect, monitor, analyze and share your critical data with Power BI dashboards on any device
 100% Secure. Zero Spam.
By submitting this form you agree with the terms and privacy policy of Softweb Solutions Inc.