In this data-centric world, it is inevitable for businesses to adopt a data-driven decision making approach. Most organizations have sufficient data that can be analyzed to make better business decisions. Yet, most businesses struggle to utilize the data to get expected tangible benefits.
Microsoft’s Power BI is an amazing tool that enables businesses to achieve more with visualization capabilities. With Azure ML and R it also enables you can make better decisions.
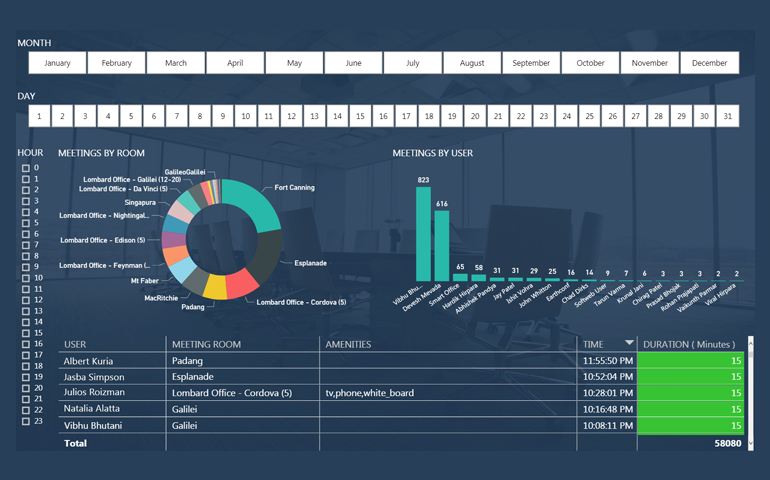
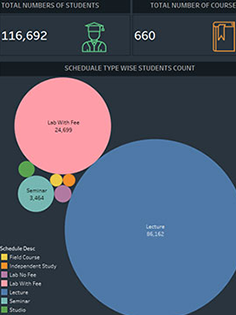
Accurate and well-executed reports provided by Power BI can save businesses time and money and help cultivate customer relationships. It enables the users with the ability to monitor KPIs in real-time and react to the data presented. Power BI provides dashboards which have multilayered data management systems. Using data mining and business intelligence to detect patterns, it presents the users with visually appealing reports. With Power BI solution, users can monitor and analyze a broad range of live data through easy-to-use dashboards, interactive reports, and compelling data visualizations.
Power BI has been recognized as a leader in Business Intelligence by Gartner Magic Quadrant, Forrester Wave and PC Magazine Editors’ Choice.
Combining Azure ML, Power BI, and R
Inculcating Azure ML and R into Power BI not only lets users get visually appealing data representation but also enables businesses to interact with the data. This can be achieved in two ways. One of the methods is by deriving the results from the model and writing it into a database; later connecting Power BI to it. You can achieve it also by using R script visual (Rviz).
However, Rviz has a benefit over the first option. It lets you select a subset of Power BI model dynamically. This gives the business a ‘what-if analysis’ add-on.
Why Power BI Dashboards are the new edge of Business Intelligence
Webinar agenda
- Introduction to Power BI
- Role of Power BI in data visualization
- Getting started with Power BI
- Benefits and business cases
- Dashboards and visualizations
The what-if game changer
Machine learning can enhance your reports so end users can gain deeper and more valuable insights from your data. Power BI has evolved as a data visualization platform with the integration of Rviz and Azure ML. This enables businesses with a what-if analysis parameter, which will further help them with predictive analysis.
By importing the data into Power BI tool, running the R script over it to train the model and enabling Azure ML Studio real-time scoring, organizations will be presented with predictive representations.
Initially, the Power BI tool enabled businesses with visualized data analysis. But with Azure ML and Rviz, they will now be able to create a visualized predictive model that will lead them to make better business decisions.
With expertise in Power BI integration, R scripts and Azure ML, Softweb Solutions provides incomparable data visualization and analytics. Our Power BI services enable the clients with adept and easy decision-making process.