
As organizations shift their data and systems to the cloud, finance departments often rapidly experience the effects of this digital transformation. Thus, the adoption of business intelligence (BI) tools in the financial services industry has skyrocketed in recent years. BI tools enable modern businesses to envision their data in the shape of dashboards to gain rich insights that increase profitability and lower costs.
In the epoch of technology, several visualization tools are available in the market. But one of the leading BI tools of the digital era is Tableau. It is a highly sought-after data visualization, interaction, and analysis tool renowned for its ability to build dashboards and streamline powerful financial analytics. Using Tableau for financial services, organizations can leverage advanced features to enhance their financial data management and reporting processes.
Today, an increasing number of financial companies worldwide are leveraging Tableau Online, Tableau Cloud, Tableau Desktop and the web to drive operational efficiencies and make data-driven decisions. Tableau Server ensures consistent security across all views, including data-level and user-level security, regardless of whether they are accessed on mobile, desktop, or the web. However, the benefits multiply by implementing Tableau dashboards with financial reports. In this blog post, you will learn the steps to implement the Tableau dashboard for financial reporting.
Steps to implement Tableau dashboards:
Tableau dashboards offer finance and accounting teams a comprehensive financial reporting solution to analyze fiscal information by different dimensions. You can create a finance dashboard in Tableau to visualize key financial metrics and drive data-driven decisions. There are mainly five steps to implement Tableau dashboards for financial reporting.
1. Validate data in transition to the cloud
The first step to building highly formatted dashboards for financial reporting is to validate the financial and accounting data in transition to the cloud. So, before you begin implementing the Tableau dashboard, you need to ensure data completeness. You can also validate the values of every column in each table. For critical tables, you can compare primary keys. It is also advisable to tie out the balance sheet and the income statement. Validating the financial data will also help you to bring in accuracy, reliability and credibility.
2. Create financial workbooks
The second step is to break up your financial data into fragments and create individual workbooks for each fragment. With these workbooks, you can work with a huge amount of datasets across different dashboards within financial workbooks. It is crucial to give each workbook an appropriate title as you may have an abundance of workbooks. For instance, a financial workbook can include dashboards for:
- Invoiced sales by customer
- Invoiced sales by brand
- Profit and loss
- Advertising and promotional summary
- ales and gross profit margin by locations
- General and administrative summary
Source: Tableau.com
3. Add dashboard objects
The third step is to add dashboard objects that will add interactivity and user appeal to your dashboards. There are different types of dashboard objects. Guidance about some of these objects are as shown below:
Web page objects –They display target pages in the light of your dashboard. Although, some web pages will not provide you the permission to embed themselves. For instance, Google.
Horizontal and vertical objects –They allow you to group relevant objects using layout containers. So, you can readjust your dashboards and allow your users to resize them when they interact with them.
Navigation objects –They will enable you to navigate from one sheet or dashboard to another. You can provide information tooltips, display text, or define custom borders using these objects.
Download objects – They will allow you to add an option of enabling users to create a PNG image, PDF file, or PowerPoint slide of your dashboard or selected workbooks.
Extension objects –They will let you add attractive and unique features to your dashboards. You can even integrate your dashboards with apps other than Tableau using these objects.
4. Enable data drill-down
The fourth step is to drill down into the financial reports to uncover the root cause of factors that influence the results. If you find any disparities in your dashboards, then by following this step, you can even identify the factors driving those variances. By carrying out a drill-down into granular details, you can determine data trends and patterns within the organization. So, to explore further, it is advisable to drill into the visualization i.e. financial reports.
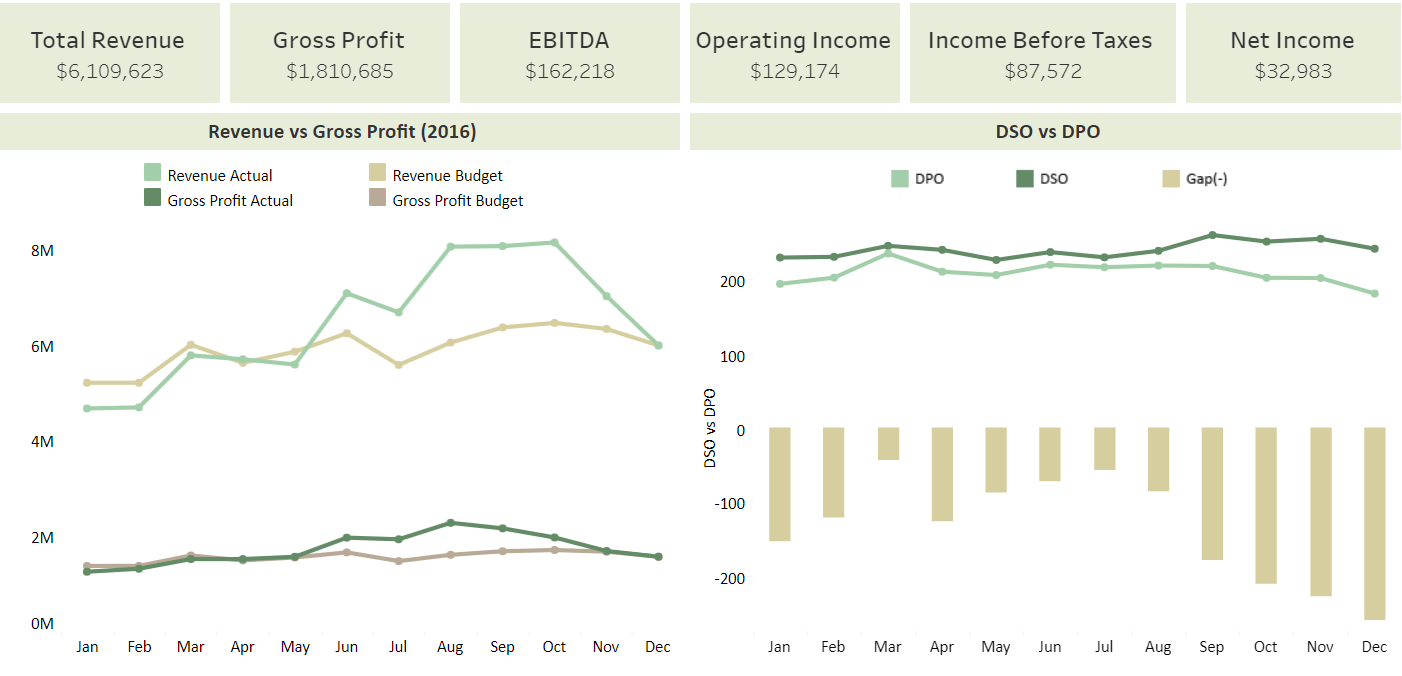
Tableau excels in providing robust solutions for financial reporting, enabling detailed insights and streamlined data visualization. For accounting teams, Tableau simplifies complex data analysis, offering intuitive dashboards for enhanced financial visibility and decision-making. Leveraging Tableau’s financial analysis dashboard empowers organizations to conduct thorough financial assessments, ensuring strategic planning and informed business strategies.
Metrics for Tableau finance dashboard
- Gross profit margin
- Operating profit margin
- Operating expense ratio
- Net profit margin
- Working capital
- Berry ratio
- Cash conversion cycle
- Accounts payable turnover ratio
- Accounts receivable turnover ratio
The future of financial forecasting
Finance moves fast. So, modern enterprises have to move beyond the financial spreadsheet to sophisticated BI solutions like Tableau for financial analytics. Gone are the days of manual processes of preparing and transforming financial data. Most organizations have turned to Tableau to create a dashboard for financial reporting to track and report on financial KPIs. A Tableau financial dashboard provides real-time insights and enhances decision-making capabilities. If you want to implement Tableau dashboards for financial reporting, then get in touch with our experts. To know about the latest feature updates in Tableau, click here.