Descriptive analytics is a branch of data analytics that examines and interprets past data to explain what took place. Business leaders ask four types of questions in data analytics to increase revenue, improve products, and retain customers.
- What happened? Descriptive analytics answers by summarizing past events.
- Why did it happen? Diagnostic analytics answers by identifying root causes.
- What might happen next? Predictive analytics answers by forecasting events.
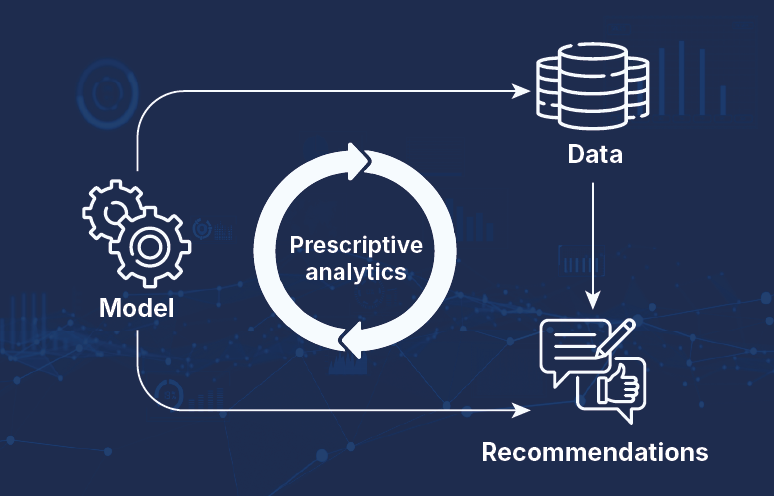
- What should we do? Prescriptive analytics answers by recommending actions.
Most executives open their business dashboard to ask: How did we perform?
Are revenue numbers climbing? Did customer engagement improve after the latest update or initiative? Which sales regions outperformed targets? Which offerings fell short of expectations?
These are the kinds of questions descriptive analytics answers. It offers a retrospective view of performance across your departments and functions. Leadership teams can measure outcomes, spot patterns, and analyze customer behavior against marketing efforts.
In this blog post, we will walk you through what descriptive analytics means, how it works, where it fits, and how top companies use it to drive clarity and results.
What is descriptive analytics?
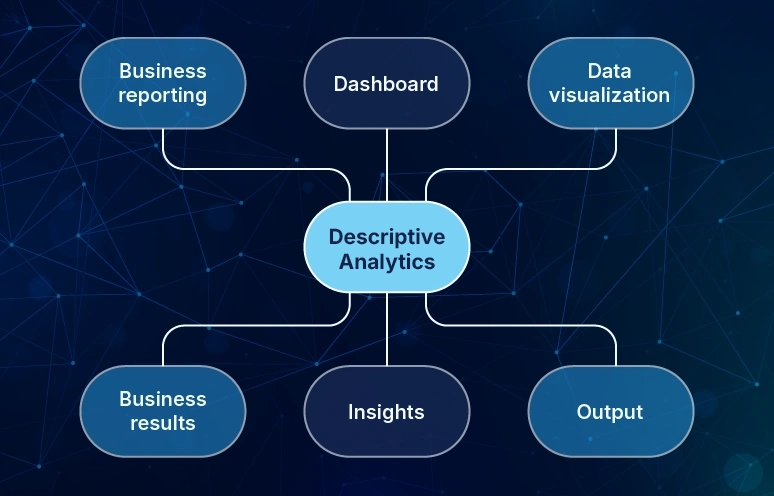
Descriptive analytics is the process that collects, cleans, summarizes, and presents historical data. Historical data analysis lets businesses identify patterns, trends, and relationships within the data. They use these insights to optimize processes, improve customer engagement, and increase profitability.
Descriptive analytics aims to provide a summary of the data which you can use to make informed decisions. It provides such insights through charts, tables, and graphs. Businesses use this approach to identify strengths and weaknesses, track progress, and support planning based on evidences.
The following are some questions you can ask using descriptive analytics.
- What happened?
- When did it happen?
- Where did it happen?
- How often did it happen?
- What were the main characteristics or features of what happened?
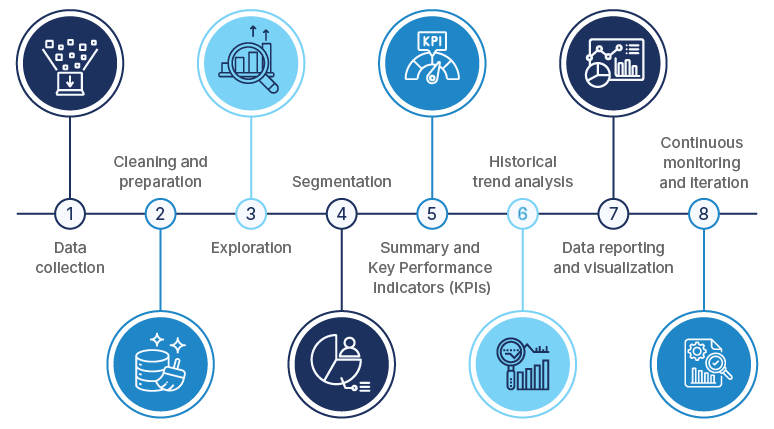
A step-by-step process of how descriptive analytics delivers insights
We have divided the descriptive analytics process into six steps. Each step plays a role in extracting insights from the data.
-
Data Collection
The process begins with data sourcing. It collects data from databases, surveys, and your other structured or unstructured sources across the organization. Ensuring data quality and integrity at this stage is critical for generating reliable business insights.
Take the example of an e-commerce company who analyzes customer purchasing behavior. They collect data such as customer IDs, purchase dates, products purchased, quantities, prices, and customer demographics.
-
Cleaning and preparation
Cleaning eliminates inconsistencies, duplicates, missing values, and outliers from the raw data. This step transforms disparate data into a consistent, analysis-ready format.
An e-commerce company might find missing values in the price column or spot duplicate records during data cleaning. They need to handle these issues to ensure data integrity.
-
Exploration
Data analysts explore your data to understand its characteristics and identify initial patterns. Summary statistics, data visualization, and exploratory data analysis are popular data exploration techniques.
Using the ecommerce data, they can create visualizations such as scatter plots or bar charts. This helps in visualizing the relationship between different variables such as price and quantity sold.
-
Segmentation
Segmentation divides datasets into subsets. It does this based on criteria like demographics, geography, time periods, or product categories. This step reveals segment-specific opportunities.
Within the e-commerce scenario, age-based customer segmentation helps identify purchasing trends and customer preferences. It provides targeted marketing opportunities.
-
Summary and Key Performance Indicators (KPIs)
In this step, the process of descriptive analytics calculates summary measures. They can range from averages, totals, percentages, to ratios, based on the subject under analysis. KPIs serve as benchmarks to assess progress or performance against specific goals.
Using ecommerce data, they can calculate KPIs like average order value, conversion rate, or customer retention rate. These KPIs help them track performance and measure progress toward business objectives.
-
Historical trend analysis
Historical trend analysis helps you understand how metrics change over time. It delivers patterns, seasonality, or long-term trends, like spotting seasonal sales peaks or product slowdowns. Identify areas for improvement, forecast performance, and improve decisions with historical trend analysis.
Historical sales data from e-commerce operations can uncover holiday peaks or evolving product preferences.
-
Data reporting and visualization
Reports and dashboards communicate insights effectively. These tools present summary statistics, visualizations, and narratives. Get an understanding of your data and act on it to take informed business decisions.
In an e-commerce context, they can create reports using line charts for sales trends. They can also use pie charts for category-wise distribution and tables for key KPIs.
-
Continuous monitoring and iteration
As new data emerges, analytics must reflect current trends. Continuous monitoring and iteration help executives to adapt strategies as data insights change.
Within ecommerce operations, monitoring of sales data helps track shifts in purchasing behavior, market trends, and customer preferences. Regular updates ensure insights stay relevant and decisions align with an evolving business environment.
Examples of descriptive analytics and how can you apply descriptive analytics
The rapid growth of data, technological progress, and the need for an edge make data analytics more popular than ever. Industries use descriptive analytics in different ways to improve their operations and drive decision-making.
Let’s look at some key examples demonstrating how you can apply descriptive analytics within various business functions.
-
Sales performance analysis
Identify top-performing offerings, assess channel or region effectiveness, and evaluate the impact of pricing or promotions by analyzing sales data. These results help you optimize sales efforts, identify underperforming products or regions, and improve sales.
For instance, you discover a sharp decline in sales for a specific product category. With this, you can explore causes like shifting customer preferences or rising competition. Based on these findings, adjust your product pricing, launch targeted campaigns, or expand related product offerings.
-
Customer segmentation
Segment customers by demographics, purchase behavior, or engagement levels. Customer segmentation helps organizations tailor marketing efforts, personalize communication, and offer customized experiences.
Let’s say you operate a subscription-based streaming service. Descriptive analytics identifies two customer segments: avid movie watchers and TV series enthusiasts. Now, you can run targeted campaigns, suggest movies to one group and promote series to the other. Personalized approach levels up customer engagement and retention and drives revenue growth.
-
Website analytics
Website analytics gives users understanding of user behavior, site design, and conversion rates. A data analytics process on page views, bounce rates, and conversions can identify performance gaps.
For example, you run an online sports goods store. You notice a high abandonment rate at the checkout process. Descriptive analytics can highlight the exact stage where users abandon their purchase. With this insight, you can optimize the checkout process, maybe by simplifying form fields or improving calls-to-action.
-
Operational efficiency analysis
Descriptive analytics helps uncover bottlenecks and streamline operations.
By analyzing KPIs, process times, and resource consumption, you can detect
inefficiencies and make better use of available resources.Assume you manage a manufacturing plant. You analyze production data and
identify a production line that consistently misses deadlines. Reach the root
cause of the delay using descriptive analytics, whether it’s because of:• equipment maintenance
• staffing issues
• process inefficienciesNow, you can take actions like preventive maintenance or resource reallocation.
Also, with a process redesign, you can improve efficiency and meet production targets. -
Financial analysis
Get your financial data analyzed to gain insights into revenue, expenses, and profitability. Reviewing financial statements, cash flow data, and cost structures can make you aware of the trends and risks. So, you can take smarter decisions.
For instance, you manage a retail business with multiple store locations. Financial data analysis can help realize which stores underperform consistently. With descriptive analytics, identify root causes like high operating costs or low sales volumes. This information can help you renegotiate lease agreements or adjust staffing levels.
Benefits of descriptive analytics usage
Descriptive analytics helps you identify what’s working and what’s not. By looking at historical data, companies can spot underperforming areas.
-
Optimize performance
Identify where performance lags by reviewing historical data. With these insights, your teams can set benchmarks, define KPIs, and take action to improve outcomes.
-
Track progress toward goals
By setting baseline metrics and tracking results, businesses can see how they perform against their targets. This visibility allows for quick course corrections and ensures strategy stays aligned with the results.
-
Increase profitability
Descriptive analytics helps identify top-performing customer segments, so you can direct marketing and sales efforts where they matter most. Better the understanding of factors that drive profitability, higher the chances of increasing profitability.
-
Prevent problems
Patterns in past data often hint at future issues. Descriptive analytics acts as an early alert system. It helps you catch problems through customer feedback trends before they become costly setbacks.
-
Additional benefits
• It can simplify communication about numerical data.
• It can improve understanding of complex situations.
• You can compare performance against the competition or across product lines.
• It can help you motivate teams and reach new goals.
By analyzing historical data, businesses can gain an edge and anticipate challenges. They can also improve communication and benchmark performance against industry standards.
Descriptive vs. Diagnostic vs. Predictive vs. Prescriptive analytics
Understanding the different types of analytics helps businesses choose the right approach. Each type serves distinct purposes and requires different capabilities and resources.
| Aspect | Descriptive analytics | Diagnostic analytics | Predictive analytics | Prescriptive analytics |
|---|---|---|---|---|
| Primary question | What happened? | Why did it happen? | What will happen? | What should we do? |
| Time focus | Historical data analysis | Historical data investigation | Future trend prediction | Future action optimization |
| Complexity level | Basic to Intermediate | Intermediate | Advanced | Most Advanced |
| Data requirements | Historical metrics and transactional data | Historical data plus contextual information | Historical data plus external variables | Comprehensive data ecosystem |
| Business value | Understanding past performance and establishing baselines | Identifying root causes and correlations | Forecasting future outcomes and trends | Optimizing decisions and actions |
Descriptive analytics provides the “what” through historical data analysis. It’s accessible to most organizations and provides value through reporting and trend analysis.
Diagnostic analytics helps you figure out why it happened. It digs into the root causes behind trends or anomalies. It relies on analytical tools and subject-matter expertise to uncover what’s really driving the results.
Predictive analytics uses machine learning and statistical models to forecast future outcomes. Getting it right often requires advanced skills and a strong data infrastructure.
Prescriptive analytics answers, “What should we do next?” It combines forecasts with optimization techniques to recommend the best actions to take in specific situations.
Most organizations begin their analytics journey with descriptive analytics. They gradually build up capabilities and move toward advanced analytical approaches as their data maturity and analytical capabilities evolve.
Frequently asked questions
1. What insights does descriptive analytics provide?
Descriptive analytics reveals historical performance patterns, customer behavior trends, sales data, and operational metrics. It helps organizations understand baseline performance, identify successful past strategies, and recognize areas for improvement. For example, it shows when customer acquisition costs are lowest or which marketing channels deliver higher conversion rates.
2. In what ways is descriptive analytics applied in business?
Businesses use descriptive analytics for marketing campaign analysis, sales tracking, financial reporting, customer segmentation, and inventory management. It creates executive dashboards, generates performance reports, supports market research, and enables strategic planning by monitoring KPIs and tracking progress toward business goals.
3. How do businesses benefit from implementing descriptive analytics?
Benefits include improved decision-making based on historical evidence, enhanced operational efficiency through bottleneck identification, better customer understanding, risk mitigation through pattern recognition, and cost optimization. It establishes a data-driven culture, enables performance benchmarking, and supports strategic planning with concrete historical context.
4. What is the connection between descriptive and predictive analytics?
Descriptive analytics provides the historical foundation that predictive analytics needs for forecasting. While descriptive shows what happened in the past, predictive uses those patterns to forecast future outcomes. Effective predictive analytics requires first understanding historical data through descriptive analysis.
5. When is it most appropriate to use descriptive analytics?
Use descriptive analytics when understanding historical performance, establishing improvement baselines, creating reporting systems, conducting post-campaign analysis, meeting compliance requirements, or beginning your analytics journey. It’s valuable for organizations new to data analytics or when stakeholders need clear historical insights.
6. What is the relationship between descriptive and predictive analytics?
The relationship is foundational and sequential. Descriptive analytics provides historical context and data quality foundation for predictive models. Organizations must understand historical patterns, quality issues, and key variables through descriptive analysis before building predictive models that forecast future outcomes.
7. What are the algorithms used for descriptive analytics?
Common algorithms include statistical measures (mean, median, standard deviation), correlation analysis, frequency analysis, time series analysis, clustering for segmentation, and aggregation functions. Data visualization algorithms create charts, while OLAP systems enable multi-dimensional analysis. Most rely on fundamental statistical techniques rather than complex machine learning.