Data analytics has emerged as a powerful tool for organizations to gain valuable insights and make informed decisions in today’s rapidly evolving technological landscape. For Chief Technology Officers (CTOs), harnessing the potential of data analytics is not just advantageous but often essential for driving innovation, optimizing operations, and staying competitive in the market.
Leveraging data analytics offers several benefits, here’s the proof:
- 91.9% of organizations achieved measurable value from data and analytics investments in 2023.
- 3 in 5 organizations are using data analytics to drive business innovation.
- 56% of data leaders plan on increasing their budgets this year.
- There could be up to 1.4 million new jobs created in data science and data analytics between 2023 and 2027.
This blog delves into the pivotal role that data analytics plays in empowering CTOs to lead their organizations towards success. From leveraging data-driven strategies to improving decision-making processes, we’ll explore how CTOs can harness the full potential of data analytics to navigate complex challenges, drive efficiencies, and unlock new opportunities.
Join us as we delve into the world of data analytics and discover how it can empower CTOs to lead their organizations toward digital transformation and business success.
Let’s understand the role of a CTO dashboard
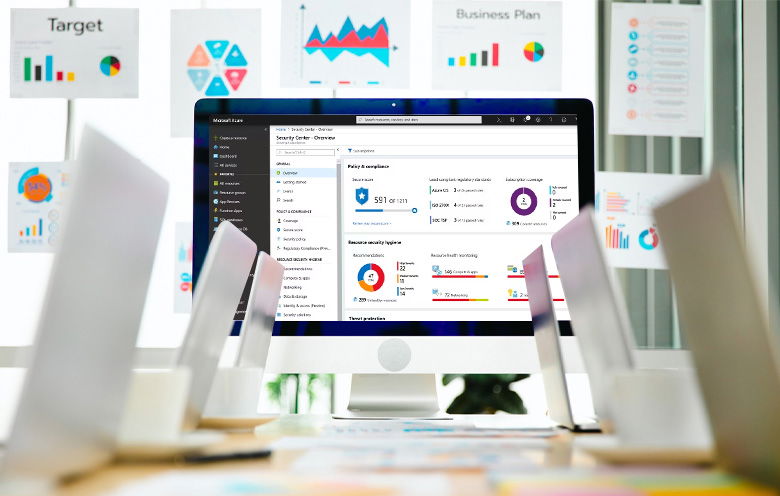
A CTO dashboard is a centralized tool that provides real-time insights into an organization’s technology landscape. It aggregates and visualizes key metrics, enabling CTOs to monitor performance, identify trends, and make strategic decisions for business growth.
This dashboard integrates data from various sources, including infrastructure performance, application usage, and customer engagement metrics, offering a comprehensive view of the IT ecosystem. With advanced analytics capabilities like machine learning and predictive modeling, CTOs can uncover patterns, forecast trends, and optimize resource allocation for maximum efficiency and ROI.
What is a CTO report?
A CTO report is a strategic document that provides a comprehensive overview of an organization’s technology landscape, performance metrics, spending insights, and key initiatives. With data analytics, CTOs can gather and analyze data from various sources, enabling them to gain actionable insights and make informed decisions. These reports play a crucial role in aligning technology strategies with business objectives and driving digital transformation initiatives.
Benefits of CTO dashboards and reports
CTO dashboards and reports offer a plethora of benefits that empower CTOs drive strategic decision-making and business growth. Here are some key advantages:
1. Real-time insights:
Data analytics enables CTOs to access real-time data insights through interactive dashboards and comprehensive reports. This real-time visibility allows for proactive decision making and swift responses to emerging trends or issues.
2. Data-driven decision-making:
CTOs can leverage advanced data analytics, machine learning, and predictive modeling to make informed decisions based on data-driven insights. This leads to more accurate forecasts, optimized resource allocation, and improved operational efficiency.
3. Performance monitoring:
CTO dashboards and reports provide a centralized platform to monitor the performance of IT infrastructure, applications, and services. This proactive monitoring helps identify performance bottlenecks, optimize system performance, and ensure a seamless user experience.
4. Strategic alignment:
By aligning technology strategies with business objectives, CTO dashboards and reports facilitate strategic alignment across departments. This ensures that technology investments and initiatives are aligned with the overall goals and vision of the organization.
5. Enhanced communication:
CTO dashboards and reports serve as effective communication tools, allowing CTOs to convey complex technical information in a clear and concise manner to stakeholders, executives, and board members. This improves collaboration, transparency, and accountability within the organization.
Key CTO dashboard metrics: Driving strategic insights with data analytics
1. Infrastructure performance:
Monitor metrics related to server uptime, network latency, and system response times to ensure optimal performance of IT infrastructure and services.
2. Infrastructure cost:
Track expenses associated with servers, storage, networking, and cloud services to optimize infrastructure spending and ensure cost-effective operations.
3. Application usage:
Track metrics such as user activity, application performance, and usage trends to identify popular features, user engagement patterns, and areas for improvement.
4. Cybersecurity metrics:
Keep a close eye on cybersecurity metrics such as threat detection rates, security incidents, and compliance status to mitigate risks and ensure data protection.
5. Customer engagement:
Monitor customer engagement metrics including user interactions, feedback ratings, and customer satisfaction scores to gauge customer sentiment and improve user experience.
6. Operational efficiency:
Track operational metrics such as resource utilization, workflow efficiency, and cost optimization to identify areas for streamlining processes and reducing operational costs.
Having delved into the intricacies of data analytics, let’s now shift our focus to explore how Azure Analytics, with its powerful suite of tools and capabilities, can specifically benefit Chief Technology Officers (CTOs).
Professional CTO dashboard examples leveraging Azure Data Analytics tools
Azure Data Analytics tools offer a wealth of capabilities for creating professional and insightful CTO dashboards. Let’s explore some examples of how these tools can be utilized:
Azure Analysis Services |
Leverage Azure Analysis Services to build interactive dashboards that provide multidimensional analysis of business data. This includes creating data models, defining KPIs, and visualizing trends for strategic decision-making. |
Azure Data Factory |
With Azure Data Factory, orchestrate data workflows, automate data integration processes, and create data pipelines that feed into CTO dashboards. This ensures timely and accurate data delivery for informed decision-making. |
Azure Data Explorer |
Utilize Azure Data Explorer to perform real-time analytics on large volumes of data. This includes monitoring system performance, analyzing log data, and detecting anomalies for proactive decision-making. |
Azure Data Lake Analytics |
Leverage Azure Data Lake Analytics for big data processing and analytics. This includes running complex queries, performing data transformations, and generating insights for CTO dashboards. |
Azure Synapse Analytics |
Azure Synapse Analytics offers integrated analytics and data warehousing capabilities. Use it to analyze data from multiple sources, perform ad-hoc queries, and generate actionable insights for their dashboards. |
Azure Databricks |
Utilize Azure Databricks for collaborative data science and analytics. This includes building machine learning models, performing data exploration, and integrating insights into their dashboards for predictive analytics. |
Datamarts in Power BI |
Leverage Datamarts in Power BI to create data models, generate reports, and visualize data from various sources. This includes building interactive dashboards with drill-down capabilities for deeper analysis. |
How to create a CTO dashboard?
Here are the steps to follow while creating a CTO dashboard:
- 1. Define objectives and goals clearly
- 2. Identify relevant data sources
- 3. Collect, integrate, and transform data
- 4. Design user-friendly dashboard layout
- 5. Incorporate interactive features for usability
- 6. Utilize advanced analytics capabilities
- 7. Test functionality and gather feedback
- 8. Deploy, monitor, and update regularly
Opt for a seamless Azure Analytics implementation
Azure Analytics presents a powerful toolkit for CTOs to harness data-driven insights and steer their organizations towards success. However, implementing Azure Analytics effectively requires expertise and strategic planning. This is where Softweb Solutions comes in. As a leading technology consulting firm, Softweb Solutions offers comprehensive services in Azure Analytics implementation.
From defining data strategies and designing impactful dashboards to deploying advanced analytics solutions, Softweb Solutions empowers organizations to leverage Azure Analytics to its fullest potential. With Softweb Solutions as your partner, you can confidently navigate the complexities of data analytics and drive transformative results for your business.