Identifying the areas that need attention or improvement has become an essential part of any business process. However, it becomes quite tedious to detect factors that influence customer behavior and areas of improvement. Organizations need to act on data faster and more effectively to identify new business opportunities ahead of the market. They require the ability to access, evaluate, and comprehend their data to seek insights from them.
Tableau is a data visualization tool that new approaches to radically improve the ability to fetch hidden acumens. It leverages visual analytics that allows users to interact with data. By leveraging Tableau, users can visually interact with data to get insights faster and make data-driven decisions.
Business intelligence is at the core of this process, empowering organizations to extract actionable insights from their data.
Audi, Bank of America, Amazon, Burger King, EY, and Kimberly-Clark Corporation are few of the top companies using Tableau. – Tableau
Tableau makes interacting with your data easy
Tableau is a very effective tool to create interactive data visualizations very quickly. It is very simple and user-friendly. Custom Tableau data visualization can create complex graphs with a similar feel to the pivot table graphs in Excel. Moreover, it can handle a lot more data and quickly provide calculations on datasets.
- Users can create visuals quickly and switch between types easily to find the model that best represents your message.
- Users can manage a huge amount of data.
- The user interface is well-organized which allows customizing the view with a few clicks.
- It is extremely easy to integrate with multiple data sources.
- It can create visualizations for a large amount of data without crashing.
It gives businesses the ability to perform fairly complex data visualization in a very intuitive, drag and drop manner. Data visualization using Tableau is remarkably interactive.
More than 70% of Tableau’s customers selected the product because of its ease of use for the business user. – Gartner
Being a Tableau consulting and development company, we have explored the features of Tableau beyond data visualization. Let’s see how it adds value beyond traditional data visualization.
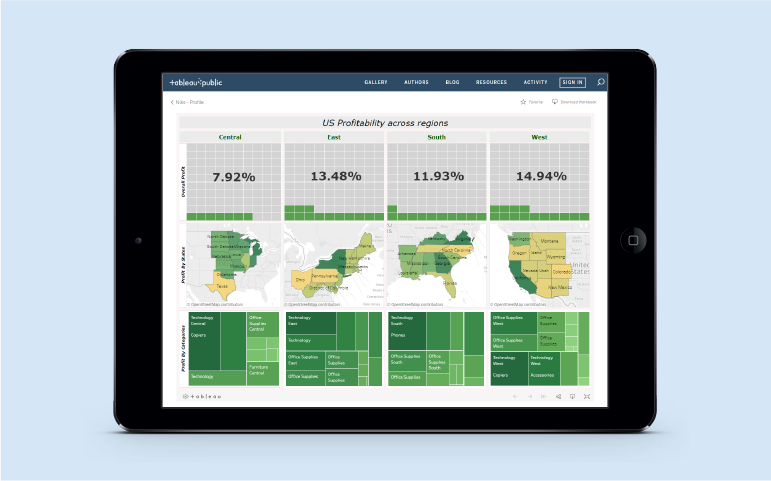
Mobile support
Tableau dashboards can be deployed at enterprise level and can be viewed and operated on multiple devices – laptop, tablet, and mobile.
Tableau has a higher percentage of users actively deploying mobile BI.
Tableau comes with a robust mobile client. Users don’t need to perform any additional steps to make dashboards mobile- friendly. With touch-optimized controls, visualizations are automatically streamlined for mobile devices. It recognizes if users are using the mobile app and makes adjustments.
Let your data tell your business story with Tableau
Webinar agenda
- Overview of Tableau and integrations
- Various data visualization trends
- Must have data analytics trends in 2021
- Use cases and live demo
- Present day examples/ case scenarios
- Q & A
Data analytics
Users can perform basic calculations and run some simple stats in Tableau itself. But if you require performing heavy artillery analytics, you can run your models in R, import results into Tableau and get visualizations of your data with ease.
By integrating R with Tableau covering, you can find patterns faster and build practical models more easily. This ultimate combination of R and Tableau amplifies data with visual analytics. In Tableau Desktop, analyses of data and interactions with them are virtually effortless. For ad hoc analysis, all you need is the right question to ask the data. This makes exploration of complex data virtually effortless.
- Businesses can use Tableau to explore and find quick patterns
- The patterns can be reproduced and further analyzed using R
- Users can create multiple charts to get meaningful insights
- It enhances the use of big data to fetch unseen patterns within the datasets
- Users can also embed the visualizations on their website
Data discovery
With in-built drill-down and data blending features of Tableau, users are enabled with correlations and trends. It enhances the data discovery by allowing the users to dig down to understand the cause of the data-patterns.
Leveraging Tableau Online and Tableau Server, users can view the most up-to-date data. Users can either maintain a live connection to underlying data, or keep data extracts fresh on a schedule.
Data discovery with Tableau gives users multiple views and angles on integrated data sources. It gives users the option to publish data sources separately or leave them embedded in their workbook.
Tableau offers a complete package
Finding key insights in data helps organizations remain competitive within their markets. As data grows in volume and velocity, organizations seek to integrate diverse and complex information. Tableau makes it possible for such organizations to provide hidden insights from their data in an easily interpretable manner.
With extensive experience in data visualization, Softweb Solutions consults enterprises about the usage and procedures to harness the power their data holds. Our in-house data visualization team leverages the statistical capabilities that R and Tableau provide. Using these capabilities, we help organizations get a 360 degree view of their business.
Tableau dashboard development results in customized reports that reflect your identity. Connect with our experts for Tableau consulting services to turn your data into insightful information.