 DCOA
DCOA
Data center infrastructure management
Sensor-driven automation on /IOTCONNECT™ + AWS. Automate manual rounds, detect failures before they happen, and keep every critical system optimized around the clock.
Our Clients





The challenges: What slows down data centers

Five tools, zero visibility
The BMS tracks cooling performance. DCIM (Data center infrastructure management) monitors rack power. SCADA manages electrical systems. And many more tools. None of them talks to each other.
No standard way of working
Every senior tech runs the same task differently. Documentation lives in PDFs nobody has read in two years.
Failures you never saw coming
Your last UPS string was supposed to have another 18 months. Your last CRAC failure cost you 47 minutes of downtime.
Capacity hidden in plain sight
Nameplate says 80%. Real load says 60%. Somewhere in that gap is the rack you didn’t have to build.
The solution: A complete automation layer for your data center operations
Deploy sensor-driven intelligence across thermal, power, environmental, and asset systems built on /IOTCONNECT™ and AWS. The platform converts raw sensor data into predictive alerts, real-time dashboards, and automated control loops without manual intervention. The solution supports facilities ranging from a single 10,000 sq ft site to large multi-site portfolios while automating four critical operational domains:
-
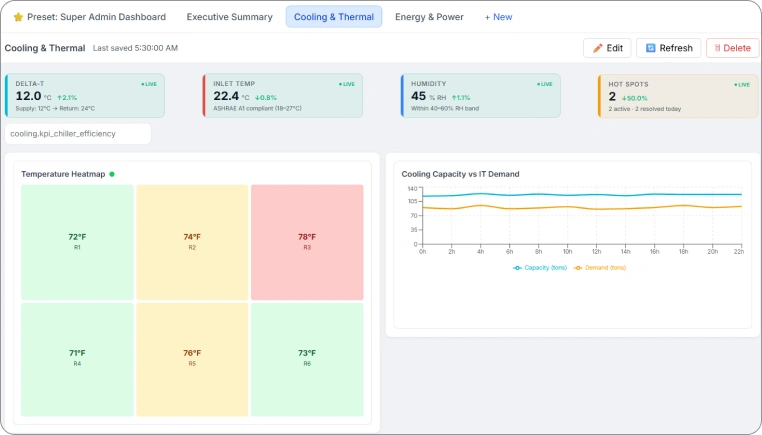
Thermal and cooling: Real-time rack temperature, hot-spot detection, and CRAC/CRAH monitoring with automated cooling control.
-
Environment and safety: Humidity, water leak, airflow pressure, access control, and video surveillance integration.
-
Power and energy: Smart PDU monitoring per outlet, PUE tracking, load balancing, and capacity planning.
-
Asset health and uptime: Vibration sensing for HDD and fan health, predictive maintenance alerts, and lifecycle analytics.
The process: How does the data center operations automation solution work?
1. See
Single pane of
glass
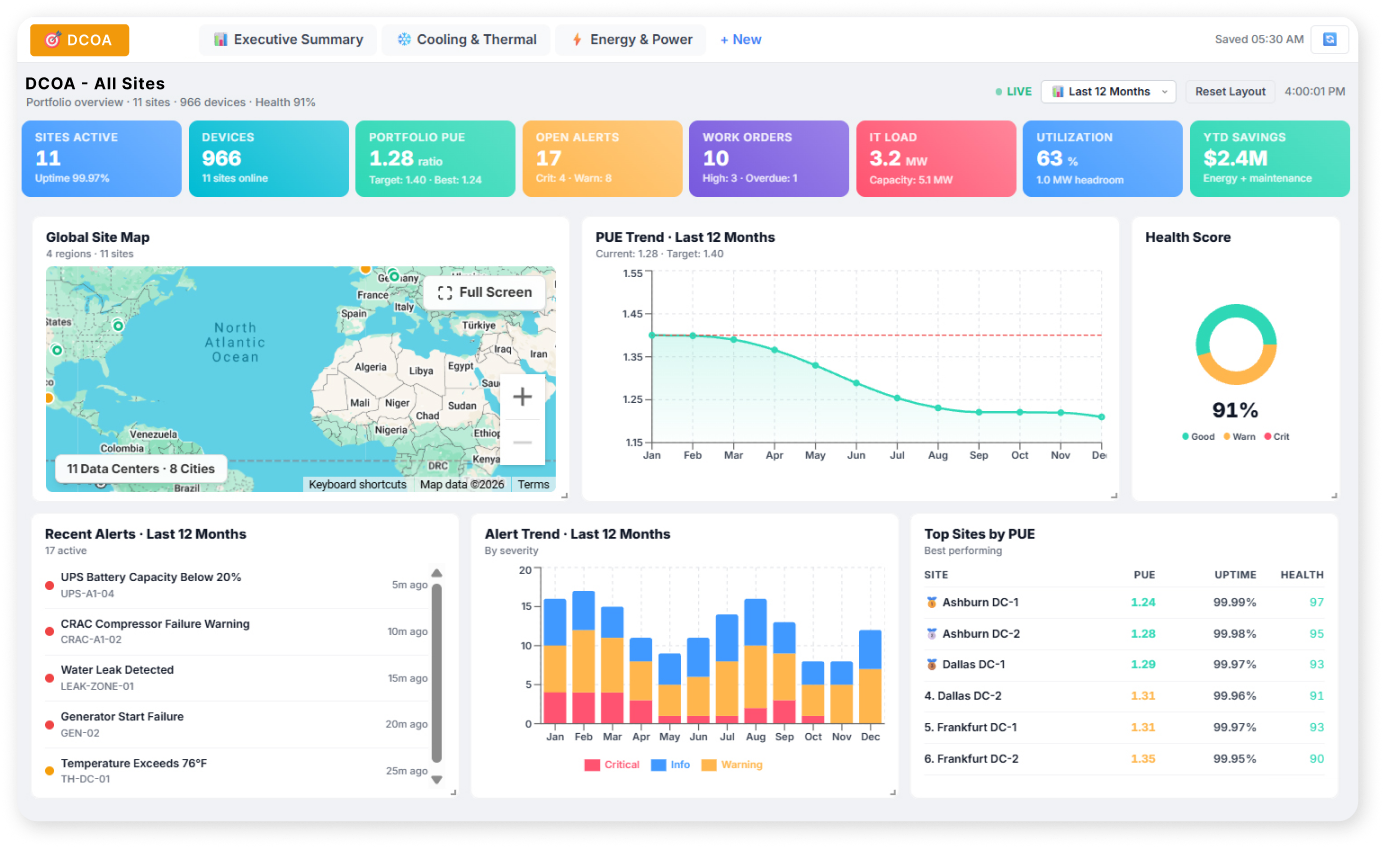
See every site, every alert, in one view.
2. Know
Predictive
maintenance
Know before it breaks, 30 to 90 days ahead.
3. Connect
Open
integrations
Connect to the tools you already trust.
4. Optimize
Energy and capacity
intelligence
Optimize PUE, reclaim capacity, and ship reports.
5. Empower
Operational
resilience
Empower tech teams with the right runbook in real time.
The capabilities: Make raw data visible and get
complete control
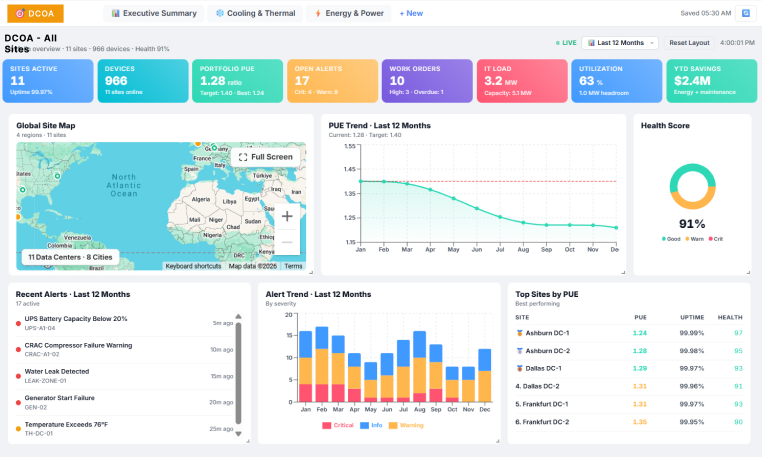
Full-spectrum site visibility:
- Real-time dashboards across all sites, thermal maps, PUE, and asset health in a single drilldown interface.
- Configurable alert thresholds with instant notification via email, SMS, and webhooks.
- Live 2D/3D facility simulation with native Power SLD, Cooling Flow, and EPMS convergence.
- Single pane of glass across all locations; drill from portfolio level to individual rack or device.
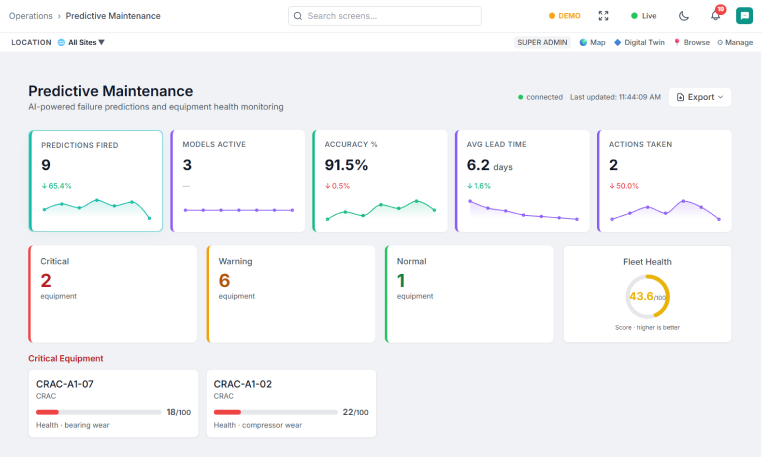
Early fault detection engine:
- Vibration, temperature, and pressure sensors on CRAH units, chillers, AHUs, and cooling towers detect degradation signals.
- Runtime-based maintenance triggers replace calendar-interval servicing. It eliminates both under- and over-maintenance.
- AI vision cameras visually confirm anomalies flagged by sensors before dispatching.
- Fire alarm panels and pre-action rooms are continuously monitored for battery health, zone status, and panel faults.
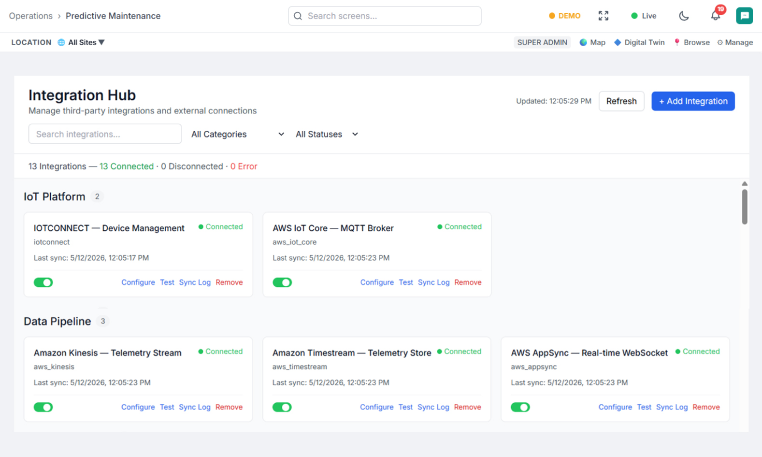
Open integration architecture:
- Native integration with BMS, DCIM (Data center infrastructure management), SCADA, EPMS, CMMS, and ITSM platforms through open APIs and industry-standard protocols.
- Real-time data synchronization across operational systems eliminates manual updates and disconnected monitoring workflows.
- Event streams and sensor telemetry routed into existing analytics platforms, ticketing systems, and enterprise dashboards.
- Flexible integration framework supports legacy infrastructure alongside modern cloud-native platforms without operational disruption.
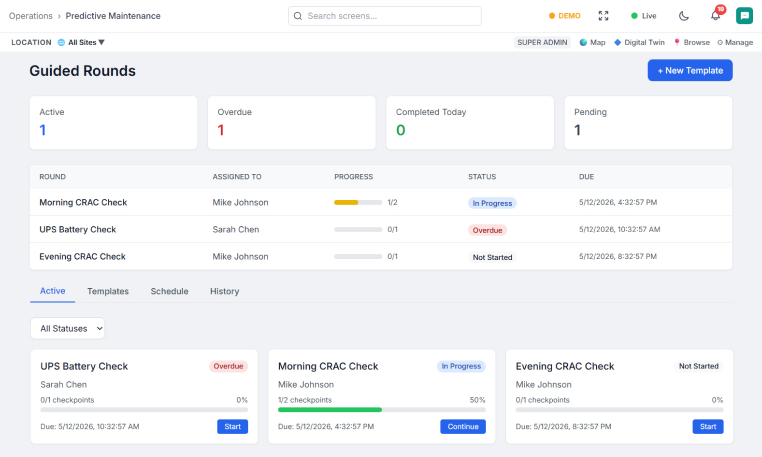
Automated incident response:
- Fault severity classified, affected system identified, and escalation workflow triggered automatically in milliseconds from detection.
- Unacknowledged alerts escalate from technician to site manager to regional executive, with full incident history attached.
- Technicians access live sensor readings, trend graphs, and AI vision feeds remotely before dispatching on-site.
- Every alert, acknowledgment, escalation, and resolution is timestamped automatically for SOC 2, ISO 27001, and SLA compliance.
Intelligent runbook delivery:
- GenAI-assisted diagnostics suggest the most likely root causes and corrective actions based on live sensor context.
- Runbook delivery is role-aware. The right guidance reaches the right technician at the right moment.
- Automated audit trails capture every diagnostic action for compliance and post-incident review.
- Bridges the experience gap between senior and junior technicians. It gives consistent response quality across every shift.
Prevent surprise failures before they disrupt operations
At $9,000 per minute of unplanned downtime, a single avoided outage delivers significant cost savings and stronger operational stability.
Book a discovery session ›The deployment readiness: Built for rapid rollout
Q2 2026 ready
The platform is production ready. All core modules, sensor onboarding, edge processing, cloud analytics, dashboards, and runbook delivery are fully available for deployment.
~40% reduction in human-error incidents
Average reduction in manual operational effort across facilities that have deployed the solution. From eliminating walkthroughs to automating escalation and compliance logging.
Weeks, not months
A structured four-stage deployment process, Discovery, Feasibility, Pilot, Production, gets you to live results in weeks. Value is validated at every stage before scaling further.
The integrations: Where your data center stack connects

Your sites
Facilities from 10,000 sq ft to 100,000+ sq ft, and multi-site portfolios of any scale. Every in-scope sensor and system feed into a single platform.

Edge
AWS Greengrass edge processing at the facility level. Low-latency local alerts, OTA firmware updates, and remote device configuration for every edge device.

Cloud
/IOTCONNECT™ on AWS. Integrated with Greengrass, Bedrock, SageMaker, Cognito, and more. Rule engines, AI model deployment, and complex pattern detection at cloud scale.

Your stack
Real-time dashboards. ERP and CMMS integration paths. Security via X.509 certificate authentication, encryption at rest and in transit, and role-based access control.
The journey: See results in 90 days
We map your telemetry, identify your top three pain points, and baseline the KPIs we’ll move together: MTTD, unplanned downtime, PUE, stranded capacity, change-failure rate.
Unified visibility goes live across one site, paired with the capability that pays back fastest for you — Predictive Maintenance, Energy Intelligence, or Operational Resilience.
Unified visibility goes live across one site, paired with the capability that pays back fastest for you — Predictive Maintenance, Energy Intelligence, or Operational Resilience.
What are the different use cases of a data center operations automation solution?
Intelligent infrastructure monitoring
Automated sensor coverage replaces 100% of labor walk-through with continuous monitoring. It captures readings every few seconds across every in-scope system, every minute of the day.
- Monitor CRAH units, AHUs, cooling towers, fire alarm panels, and pre-action rooms continuously via sensors.
- Capture temperature, humidity, pressure, flow rate, valve status, and power readings in real time.
- When a reading drifts out of threshold, /IOTCONNECT™ alerts the right persona with full context.
- Auto log all readings for compliance, audit trails, and SLA reporting. Zero manual documentation.
Predictive maintenance
/IOTCONNECT™ tracks hours per unit and captures continuous sensor baselines. It triggers maintenance work orders automatically when degradation patterns emerge.
- Vibration, temperature, and pressure sensors on CRAH units, chillers, AHUs, and cooling towers detect degradation signals.
- Runtime-based maintenance triggers replace calendar intervals and prevent under- and over-servicing.
- Monitor fire alarm panels and pre-action rooms for battery health, zone status, and panel faults.
- AI vision cameras provide visual confirmation when sensor data flags an anomaly.
Energy optimization
Dynamic cooling modulates CRAH and AHU output based on live sensor data from actual rack temperatures. Automation reduces cooling energy waste.
- CRAH units and AHUs adjust output in real time based on rack-level heat load.
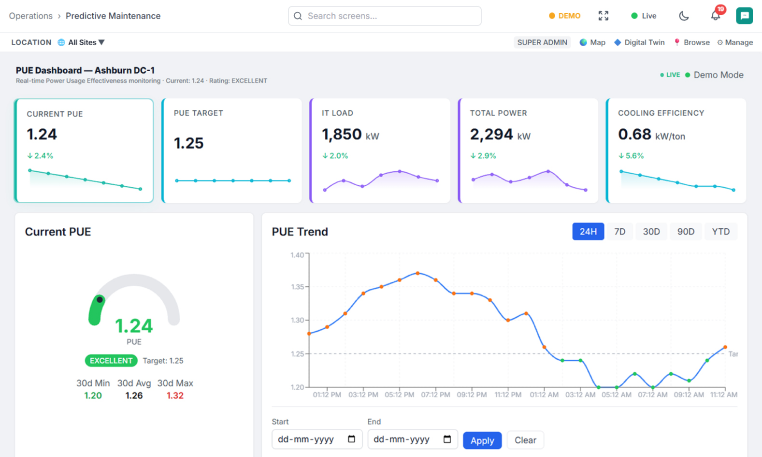
- PUE tracked live across all power feeds with automated trend analysis and anomaly detection.
- Optimize cooling tower and chiller efficiency through flow rate, approach temperature, and fan speed sensors.
- Smart meters across PDUs and UPS systems generate automated consumption reports for OPEX forecasting.
Incident response automation
Automated fault triage, role-based escalation, and GenAI runbooks close the gap from milliseconds of sensor detection to resolved incidents.
- Fault severity classified, affected system identified, and escalation workflow triggered automatically.
- Unacknowledged alerts escalate from technician to site manager to regional executive with full incident history.
- Technicians remotely access live sensor readings, trend graphs, and AI vision feeds before dispatching on-site.
- Every alert, acknowledgment, escalation, and resolution timestamped for SOC 2, ISO 27001, and SLA compliance.
Automated sensor coverage replaces 100% of labor walk-through with continuous monitoring. It captures readings every few seconds across every in-scope system, every minute of the day.
- Monitor CRAH units, AHUs, cooling towers, fire alarm panels, and pre-action rooms continuously via sensors.
- Capture temperature, humidity, pressure, flow rate, valve status, and power readings in real time.
- When a reading drifts out of threshold, /IOTCONNECT™ alerts the right persona with full context.
- Auto log all readings for compliance, audit trails, and SLA reporting. Zero manual documentation.
/IOTCONNECT™ tracks hours per unit and captures continuous sensor baselines. It triggers maintenance work orders automatically when degradation patterns emerge.
- Vibration, temperature, and pressure sensors on CRAH units, chillers, AHUs, and cooling towers detect degradation signals.
- Runtime-based maintenance triggers replace calendar intervals and prevent under- and over-servicing.
- Monitor fire alarm panels and pre-action rooms for battery health, zone status, and panel faults.
- AI vision cameras provide visual confirmation when sensor data flags an anomaly.
Dynamic cooling modulates CRAH and AHU output based on live sensor data from actual rack temperatures. Automation reduces cooling energy waste.
- CRAH units and AHUs adjust output in real time based on rack-level heat load.
- PUE tracked live across all power feeds with automated trend analysis and anomaly detection.
- Optimize cooling tower and chiller efficiency through flow rate, approach temperature, and fan speed sensors.
- Smart meters across PDUs and UPS systems generate automated consumption reports for OPEX forecasting.
Automated fault triage, role-based escalation, and GenAI runbooks close the gap from milliseconds of sensor detection to resolved incidents.
- Fault severity classified, affected system identified, and escalation workflow triggered automatically.
- Unacknowledged alerts escalate from technician to site manager to regional executive with full incident history.
- Technicians remotely access live sensor readings, trend graphs, and AI vision feeds before dispatching on-site.
- Every alert, acknowledgment, escalation, and resolution timestamped for SOC 2, ISO 27001, and SLA compliance.
Why data center operators choose Softweb’s DC operations automation solution
Avnet + AWS partnership
Built on /IOTCONNECT™ and integrated with AWS services including Greengrass, Bedrock, SageMaker, Lookout, Cognito, and Cedar AVP.
Proven ROI model
We consider labor calculations, outage cost data, and energy savings projections to justify investment before a single sensor is deployed.
Deployable in weeks
The solution deploys in weeks with a structured four-stage process that validates value at every step. Your team sees results and receives training.
Replicate across the portfolio
Once deployed at one facility, the platform replicates across additional sites. Your dashboard remains the same for the entire portfolio.
Find out if data center operations automation is right for you.
Schedule a discovery workshop with our team and walk away with an automation roadmap, ROI model, and integration plan built around your facility.
Schedule a call ›
