Modern enterprises rely on continuous data flows to power analytics, support decision making, and respond to changing market conditions. With traditional, script-heavy processes, much of an engineer’s day goes to pipeline upkeep rather than insight-driven work.
According to a Gartner survey, data professionals spend 56% of their time on operational execution, leaving only 22% for innovation and analysis. That imbalance can delay critical reports by days and limit the strategic impact of your analytics programs.
Reliable pipelines turn constant data movement into real-time insight, but building them requires specialized skills in orchestration, quality, and monitoring. An experienced data-engineering partner can accelerate time to value and deliver measurable business impact more quickly.
In this blog post, we clarify what data-pipeline automation is, outline common pipeline types and key components, present five key benefits, and provide a step-by-step guide with a tools landscape to help you design resilient, event-driven workflows.
What is data pipeline automation?
Data pipeline automation is the practice of using software to ingest, transform and deliver data on a set schedule or in response to events. It removes the need for manual scripts and constant oversight. Instead of ad-hoc code or spreadsheet-based handoffs, an automation platform connects to source systems, enforces data-quality rules, and loads results into storage or analytics tools without human intervention.
At its core, automation relies on two key elements:
- Orchestration: A controller that sequences tasks, handles retries, and routes data on success or failure.
- Declarative configurations: Human-readable definitions of sources, transformations, and destinations that adjust easily when requirements change.
For example, an online retailer schedules a 2 a.m. pipeline that ingests sales logs, removes duplicates, segregates by product category, and loads a reporting table. If a cleansing step finds unexpected values, the system retries, sends an alert, or isolates bad records for review, and no engineer is paged outside of business hours. Automating these routines ensures consistent execution, reduces errors, and speeds access to fresh data.
4 Types of data pipelines
Pipeline design choices affect latency, cost and compliance. The four styles below fit distinct business scenarios.
1. Batch data pipeline
On a fixed schedule, hourly, nightly or at other defined intervals, a batch pipeline extracts, transforms and loads large volumes of data. This approach suits historical analyses, end-of-day reporting, and month-end reconciliations.
2. Real-time data pipeline
As events occur, a real-time pipeline ingests and processes continuous streams of data, enabling instant analytics, real-time alerts and monitoring. Teams often use this for fraud detection, personalized recommendations, and other use cases that demand sub-second responsiveness.
3. On-premises data pipeline
Running entirely within a company’s own data center, an on-premises pipeline connects directly to databases, file servers and message queues. It provides maximum control over security, compliance, and network configuration while integrating seamlessly with legacy systems.
4. Cloud native data pipeline
Built and managed in a public cloud environment using managed services or serverless components, a cloud native pipeline elastically scales to handle variable workloads, reduces infrastructure overhead and integrates natively with cloud storage, data warehouses and analytics platforms.
Key components of an automated data pipeline
Automating data flows requires four foundational elements. By ensuring that data is ingested correctly, transformed accurately, executed in the right order and continuously monitored, teams can eliminate hidden bottlenecks and guarantee that every report reflects current information. The sections below explain each component’s purpose, function, and how it contributes to a robust automated pipeline.
Ingestion
Ingestion is responsible for connecting to every source system, including databases, APIs, message queues or flat files, and pulling raw data into the pipeline. This step often includes:
- Schema validation: This step verifies that incoming data matches expected table or field structures before it enters the pipeline.
- Basic error checks: This process detects missing fields, malformed records or encoding issues and prevents invalid data from progressing to transformation.
- Data buffering or temporary storage: Incoming batches or streams are held in a staging area to smooth out volume spikes and avoid downstream backlogs.
By catching schema mismatches and format errors early, ingestion prevents bad records from contaminating downstream workflows.
Processing
Processing covers all the transformation logic applied to raw data, including:
- Cleaning: The pipeline removes duplicate entries, null values or invalid data points according to defined business rules.
- Enrichment: Raw records are joined with reference tables, external data is fetched or calculated fields are applied. For example, deriving a customer segment from demographic attributes.
- Aggregation: Detailed records are summarized into higher-level metrics, such as daily totals or hourly averages, to support efficient reporting.
- Normalization: Various data types and field formats (for example, currency, date/time or unit conventions) are converted into a consistent structure.
These transformation tasks ensure that data is accurate, consistent and optimized for analytical queries or machine-learning models.
Orchestration
The orchestration engine sequences every task in the pipeline, enforces dependencies and handles retries or branching logic. Its main responsibilities include:
- Task scheduling: Ingestion, processing and load jobs run according to SLAs, for example, executing batch jobs at 2 AM or triggering flows when a new file arrives.
- Retry policies: Failed steps are automatically retried, for example, reattempting a failed database connection up to three times before raising an alert.
- Dependency enforcement: Downstream transformations execute only after all upstream tasks complete successfully, like preventing a join operation until both source tables have been loaded.
- Conditional branches: Data is routed into alternative flows, such as quarantining bad records or reprocessing only changed partitions, based on runtime checks.
By abstracting these concerns into a declarative definition (for example, via code or configuration files), orchestration allows pipelines to adapt quickly when business requirements change.
Monitoring
Monitoring continuously tracks each pipeline’s health and performance using logs, metrics, and alerts. Key monitoring functions include:
- Job status tracking: The system records start and end times, success or failure states, and execution durations for every pipeline task.
- Data-quality metrics: Row counts, null rates and schema drift indicators are measured to detect anomalies before they impact reports.
- Alerting: Stakeholders, such as on-call engineers or data stewards, are notified automatically when a failure occurs or when a data-quality threshold is breached.
All four components, ingestion, processing, orchestration and monitoring, work together to deliver a resilient, scalable and easy-to-maintain automated pipeline. By defining their functions and interactions explicitly, teams can build systems that adapt as data volumes grow, and requirements evolve.
How data pipeline automation works
Automated pipelines work best when they can seamlessly adjust to new data and avoid interruptions. The fingerprint, detect and propagate sequence helps by first capturing a baseline of data, then finding any changes and finally updating tasks automatically. These steps work together to keep your workflows running smoothly, ensure data integrity and accelerate time to insight.
Fingerprint
When new data or updated transformation code enters the pipeline, the system uses a SHA (secure hashing algorithm)-based hashing mechanism to generate a unique fingerprint for each data batch and each code snippet. These fingerprints form nodes in a directed acyclic graph (DAG), which represents data and code dependencies throughout the workflow. By recording metadata like record counts, field names and data types alongside each code fingerprint, the platform creates an immutable baseline. This metadata graph makes it possible to trace, track and manage every change from source to sink with full transparency.
Detect
Whenever new data or revised transformation code arrives, the automation controller compares its fingerprint against the stored baseline. Any mismatch, such as a new column name, a data type change or altered logic in a transformation script, triggers a detection event. The controller then traverses the dependency graph to identify all downstream tasks that rely on the changed element. This ensures that any potential issue is caught before it impacts production workloads.
Propagate
Once a change is approved, either automatically for non-breaking updates or manually for critical modifications, the controller regenerates an updated execution plan. It pushes the change through each dependent node, updating configuration files, rewriting affected SQL and adjusting downstream logic without requiring engineers to rewrite code. If an error arises, the system pauses at the failure point, alerts the responsible engineer and resumes from that same point after the fix. This process guarantees that no workloads are reprocessed unnecessarily and maintains end-to-end data integrity.
5 benefits of data pipeline automation
By automating data workflows, organizations reduce error rates and accelerate decision-making that drives business outcomes. Below are five core advantages that teams consistently realize.
1. Improved data quality
Manual pipelines and handoffs introduce inconsistencies, schema mismatches and outdated records. Automation enforces validation rules at every stage, catches anomalies early and isolates problematic data for review. As a result, data remains accurate and reliable across all downstream processes.
2. Faster time to insight
When data moves smoothly through an automated pipeline, analytics and BI teams gain access to fresh information without delays. Instead of waiting for manual handoffs, stakeholders see near real-time data in dashboards and reports enabling quicker decisions and more timely actions. For example, a marketing manager can adjust a promotional offer within minutes of detecting an unexpected spike in user clicks, rather than waiting for end-of-day reports.
3. Enhanced scalability
Automated pipelines handle growing data volumes and changing workloads with minimal manual intervention. As data sources expand or usage spikes, the system adapts by scaling compute and storage resources automatically. This approach keeps performance stable as data volumes and workloads grow. For example, an e-commerce site using a serverless pipeline can scale from zero to thousands of events per second during Black Friday traffic surges without any manual configuration, ensuring no data is lost when order volumes spike.
4. Lower operational costs
Relying on manual scripts, spreadsheets and ad hoc fixes demands ongoing effort and introduces risk. By automating ingestion, transformation and scheduling, organizations reduce the need for large support teams. Over time, savings from fewer incidents, less rework and leaner staffing often offset investments in automation tools.
5. More time for innovation
Automating routine tasks such as data ingestion, transformation and validation frees engineers from repetitive work. With fewer manual processes to maintain, teams can dedicate more effort to building new features, exploring advanced analytics or refining data models.
How to build an automated data pipeline?
Building an automated data pipeline requires collaboration among multiple roles, from business stakeholders to technical experts. Below are seven steps, each illustrating who is responsible and how they contribute to a successful implementation.
Step 1: Define objectives and requirements
Data product managers and business analysts work with stakeholders to define business goals and identify key metrics. They clarify how the pipeline will support decision-making, specify data sources, expected volumes and latency targets, and outline how downstream teams will use the output.
At the same time, operations leads and data architects define service-level agreements for data freshness and accuracy, ensuring that reporting and analytics meet operational timelines. Security engineers then establish compliance and data protection requirements, including encryption standards, audit logging practices and access controls.
Step 2: Profile and catalogue data sources
Data engineers and analytics leads inventory each source system, including databases, files or APIs, and document formats, schemas and expected update frequencies. They perform initial data profiling to assess quality, completeness and consistency, flagging any missing values or outliers. Platform administrators identify required connectors and ensure that access credentials and network permissions are in place.
Step 3: Choose architecture and tools
With requirements and source details in hand, solutions architects and senior data engineers evaluate architectural options and select appropriate tooling. They consider factors such as scalability, latency tolerance (batch versus streaming), cloud versus hybrid infrastructure, and integration needs across the entire stack. Solutions architects and senior data engineers begin by evaluating orchestration platforms that handle task sequencing, retry logic and dependency management. Next, they select a transformation framework or ETL/ELT tool that offers declarative configurations and built-in data-quality checks. They then determine appropriate storage technologies, such as a data warehouse, data lake or real-time analytics store, based on performance and query requirements. Finally, they review monitoring and alerting solutions to ensure every job’s status and data-quality metrics are captured and reported effectively.
Step 4: Design the end-to-end workflow
Solutions architects and data engineers sketch a comprehensive flow diagram that maps ingestion, transformation, error handling and load steps. They define checkpoints where data validation or schema checks occur, and design branching logic for handling anomalies, such as routing malformed records to a quarantine table or reprocessing only changed partitions. This design ensures that every step has clear entry and exit conditions and minimizes unexpected failures in production.
Step 5: Implement ingestion and transformation logic
Data engineers or ETL developers build connectors or use prebuilt adapters to extract data from each source system. They apply transformations such as cleaning, filtering and aggregating using modular, idempotent code or declarative rules, enforcing data-quality checks like schema validation and null checks before loading into the next stage. Code review is done by senior engineers and data stewards to confirm that transformations meet business requirements and adhere to naming conventions.
Step 6: Configure orchestration and scheduling
Data engineers working with DevOps teams set up task dependencies and execution order so that each step runs only when prerequisites succeed. They define retry policies, for example retrying a failed database connection up to three times before raising an alert and configure notification rules to route alerts to the appropriate on-call channels. Finally, they schedule pipeline runs according to SLAs. For batch processing, jobs run at fixed intervals; for event-driven flows, pipelines trigger automatically when a new file arrives.
Step 7: Test, validate and deploy
Quality assurance engineers and data engineers perform unit tests on individual transformations and integration tests on the full workflow. They validate end-to-end data flows against known test cases, comparing expected outputs with actual results. Once testing succeeds, DevOps teams deploy pipelines to production using version control and automated deployment pipelines. They establish a rollback plan to revert to the previous stable version if needed and ensure that operations documentation is in place for ongoing maintenance and knowledge transfer.
By assigning clear responsibilities and following these steps, organizations can implement a robust automated pipeline that scales reliably, meets business goals and delivers timely, accurate data for analytics and other downstream uses.
Tools for data pipeline automation
Choosing the wrong tool can undermine your automation efforts, introducing hidden bottlenecks or maintenance headaches. Below, tools are organized by orchestration, ETL/ELT and monitoring to help you align choices with your performance, governance and growth objectives.
Orchestration
- Apache Airflow (open source)
Workflow engine that uses directed acyclic graphs to schedule and manage complex pipelines. - Prefect (open source/commercial)
Modern orchestration platform with a Python-native API to build, schedule, and monitor pipelines. - Cloud Composer (managed)
Google Cloud’s managed Apache Airflow service for scalable orchestration without infrastructure overhead. - Azure Data Factory (managed)
Microsoft Azure’s cloud-based data integration and orchestration service with drag-and-drop authoring.
ETL/ELT
- dbt (open source/commercial)
SQL-based transformation tool that enables modular, version-controlled transformations in data warehouses. - Talend (commercial)
Comprehensive data integration suite offering connectors, transformation components and data quality features. - Apache NiFi (open source)
Dataflow tool that supports real-time ingestion, routing and transformation with a visual interface. - Matillion (commercial)
Cloud-native ETL/ELT solution built specifically for modern data platforms like Snowflake and Redshift.
Monitoring
- Prometheus (open source)
Metrics monitoring system with alerting and a powerful query language for custom alerts. - Grafana (open source/commercial)
Visualization platform that integrates with Prometheus, InfluxDB and other data sources to display pipeline health dashboards. - Monte Carlo (commercial)
Data observability platform that detects data quality issues and lineage problems before they impact production. - Elastic Stack (open source/commercial)
Log aggregation and analysis solution for collecting pipeline logs, visualizing metrics and setting up alerting.
These tools cover all core needs, including scheduling and orchestration, data transformation and quality, and end-to-end monitoring, whether you prefer open-source flexibility or a managed commercial service.
Data pipeline automation architecture
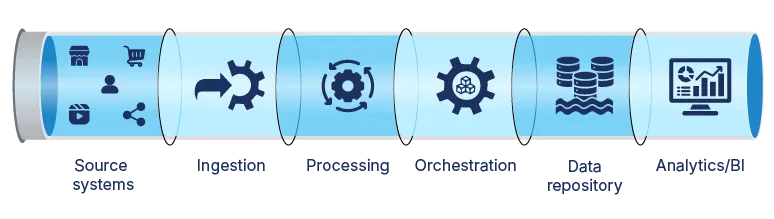
Effective automation depends on a clear, modular structure that connects raw data sources to analytics with minimal manual effort. The diagram below shows how each stage collaborates to maintain data quality, manage workflows, and deliver insights faster.
Stage-by-stage overview
- Source systems
Databases, file stores and APIs where raw data originates. Identifying all sources and their formats is essential to avoid surprises downstream. - Ingestion
Connectors pull data into the pipeline while performing schema checks and basic validation. Early error detection here prevents bad records from slowing later stages. - Processing
This stage cleans, enriches and standardizes records into consistent formats. Modular transformations enforce quality rules and reduce the risk of downstream failures. - Orchestration
The central scheduler sequences tasks, handles retries and enforces dependencies. Automated triggers and alerts replace manual job runs, keeping workflows on pace with defined SLAs. - Data repository
A centralized store, such as a data warehouse or data lake, indexes processed data for fast queries and efficient storage. Optimized layouts accelerate analytics performance. - Analytics/BI
Dashboards and reports connect directly to the repository, using up-to-date data to drive decisions. By eliminating manual handoffs, this stage ensures stakeholders see current insights without delay.
Each stage contributes to a resilient, end-to-end pipeline. Validating data early catches errors before they propagate into downstream systems, and consistent transformations ensure a uniform format and adherence to business rules. Automated task coordination removes manual delays, and real-time result delivery ensures stakeholders receive current insights immediately.
Reclaim engineering time and accelerate insights
Engineers who spend most of their day fixing broken pipelines and rerunning jobs cannot focus on delivering strategic insights or building new data services. Partnering with a proven data-engineering firm brings specialized expertise and a tested methodology, accelerating ROI while minimizing risk. When evaluating potential partners, look for experience in implementing automation in your industry, clear success metrics and a track record of seamless integration with existing systems.
Softweb Solutions’ data engineering consulting services pinpoint pipeline bottlenecks and implement targeted automation. This work turns manual tasks into reliable automated workflows so your team can focus on high-value analytics. Contact us today to discover the business impact of automating your pipelines.
FAQs
1. What does “manage changes within pipelines” mean?
Managing changes means handling schema updates, new data fields or source modifications without manual intervention. Automation tools record a secure fingerprint of both incoming data and user-defined transformation code. When new data or modified code arrives, the system compares fingerprints to detect any changes immediately. Once a change is identified, the platform automatically updates all downstream transformations and configurations, so tasks continue running smoothly without manual intervention.
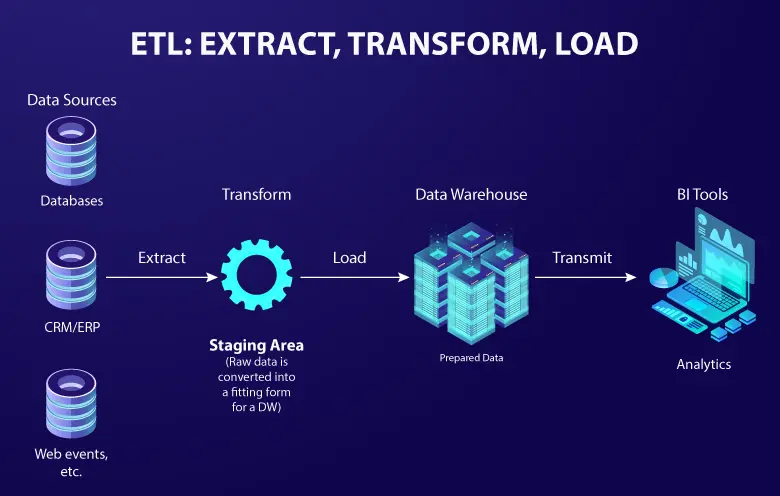
2. What is the difference between ETL and data pipeline?
ETL (extract, transform, load) focuses on moving and transforming data in discrete batches. A data pipeline encompasses ETL but also includes orchestration, monitoring, and the ability to handle real-time streams. Pipelines allow conditional logic and checkpoint failures to be handled automatically, so only valid data progresses downstream.
3. Which tools are best for data pipeline automation?
Leading options include Apache Airflow and Prefect for orchestration, dbt and Talend for transformations, and Prometheus or Grafana for monitoring. Cloud-managed services such as Azure Data Factory or Amazon Managed Workflows provide end-to-end automation without infrastructure overhead.
4. Is data pipeline automation suitable for small businesses?
Yes. Small teams can start with open-source or cloud-managed tools that scale with growth. Managed services lower setup complexity and costs, letting small businesses automate key workflows such as nightly report jobs without large engineering investments.
5. How do I start automating my data pipeline?
Begin by cataloguing data sources and defining success metrics. Choose a pilot use case like nightly batch ingestion, select tools that match your tech stack and build a proof of concept. Test, refine and expand gradually to cover additional workflows and data domains.