Retail stores are under constant pressure to achieve sales targets, especially since the turn of the century, and even more so, in the past decade. The steady increase of eCommerce and mCommerce is supposedly eating into the retail pie. But the retail sector, like many other industries, is itself undergoing a major transformation, receiving a much needed boost in the form of newer technologies.
Customer demands have significantly changed. There is a huge focus on information, meaning that customers want as much knowledge about a product from various types of sources such as websites and mobile apps. And they want all of this in real-time. To maximize the potential of retail stores, business owners have to meet these requirements to attract new customers and retain existing ones. This also means that retailers require insights to further their sales efforts.
You want your retail store to achieve higher sales. You want to reduce costs related to operations and customer acquisition. You want to deliver awesome customer experiences. These are constant requirements of a retail business. How does one attain these?
You just have to see it to believe it
It has been proven long ago that the human brain can process images much faster than text. Also, a survey from Bain & Company says that “Companies using analytics are 5 times more likely to make faster decisions.” Visuals work on various levels within an organization and also lead to insightful answers, making data visualization a core constituent of any business.
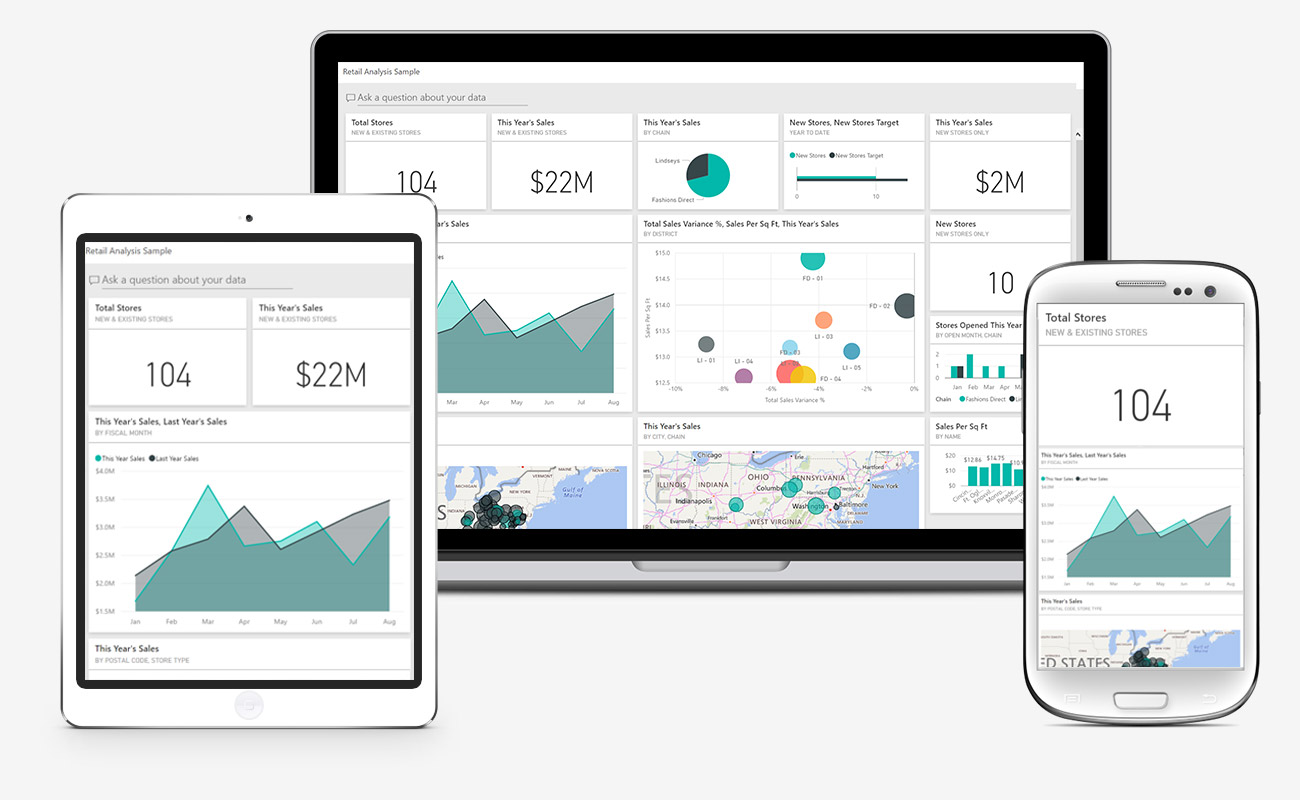
This brings us to the topic of discussion, and a singular answer to the questions which have been raised above – Microsoft Power BI. You will see interactive reports which have all the necessary metrics that you need to achieve your business goals.
Get quick and visual answers in natural language to questions like:
- Give me a breakdown of $100 or higher items sold during the Christmas period
- Show me all the days with less than 40 walk-ins from January to March
- Which days of the week warrant the highest energy usage over the course of 2016?
If old is gold, then new is platinum
A retail outlet has way too many data points. The biggest question is how many are being used? Your data is most likely fragmented between structured, semi-structured and unstructured data, which could be stored in a number of places and various formats. Your retail establishment can have biometric scanners, CRM software, mobile apps, and web sites among others.
All these points generate a lot of data and have the ability to provide you with new business opportunities and revenue streams. The more data points your store sets up, the higher are your chances for accurate analysis.
Go from numerical hell to visual paradise
Excel sheet analysis will give you a basic understanding, help you to realize a few parameters of your business or it might just throw you in numerical hell, which is that one place no business owner wants to go to. Bad or erroneous analysis can lead to a lot of rework or even wrong decisions, which can have serious repercussions. These are some of the reasons why businesses lose money and time.
Empower the right personnel with state-of-the-art BI capabilities so that they can create relevant dashboards, generate reports and not waste time in seeking information or plotting tables. Power BI enables you to act on your data, and not statistical theories or approximations. Adding visualizations to the analysis increases the capability of gathering insights, giving the user the ability to take informed decisions.
Yes, I see the promise of Power BI, but how do I see it in action?
Join us for our webinar titled, ‘Why Power BI Dashboards are the new edge of Business Intelligence.’ You will be walked through 45 minutes of a dedicated video session by our Power BI experts. It will start with an introduction to Power BI followed by its role in the data visualization landscape.
We will also cover the benefits and present a few business cases with real dashboards and visualizations. The webinar will end with a Q & A session, where we will try to answer all the questions from the attendees. Upon completion, the webinar will be available online and also be sent to you via email, along with the questions and answers covered during the webinar. So all you have to do is register for the webinar and we will take care of the rest.